Managerial Dashboard
تفاصيل العمل
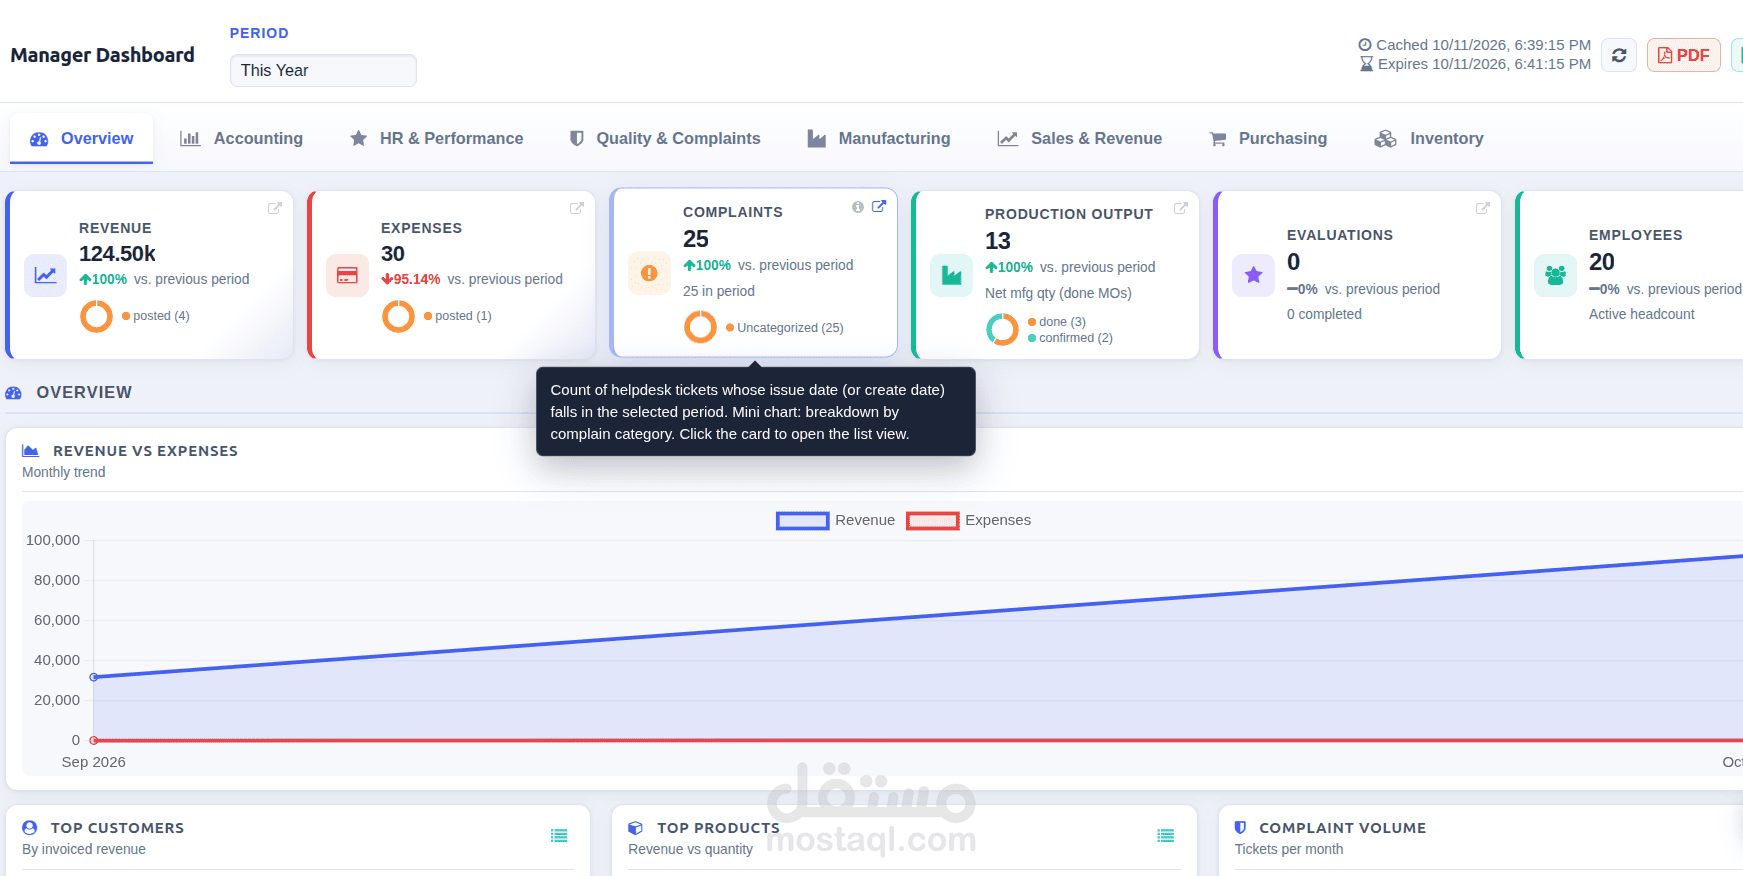
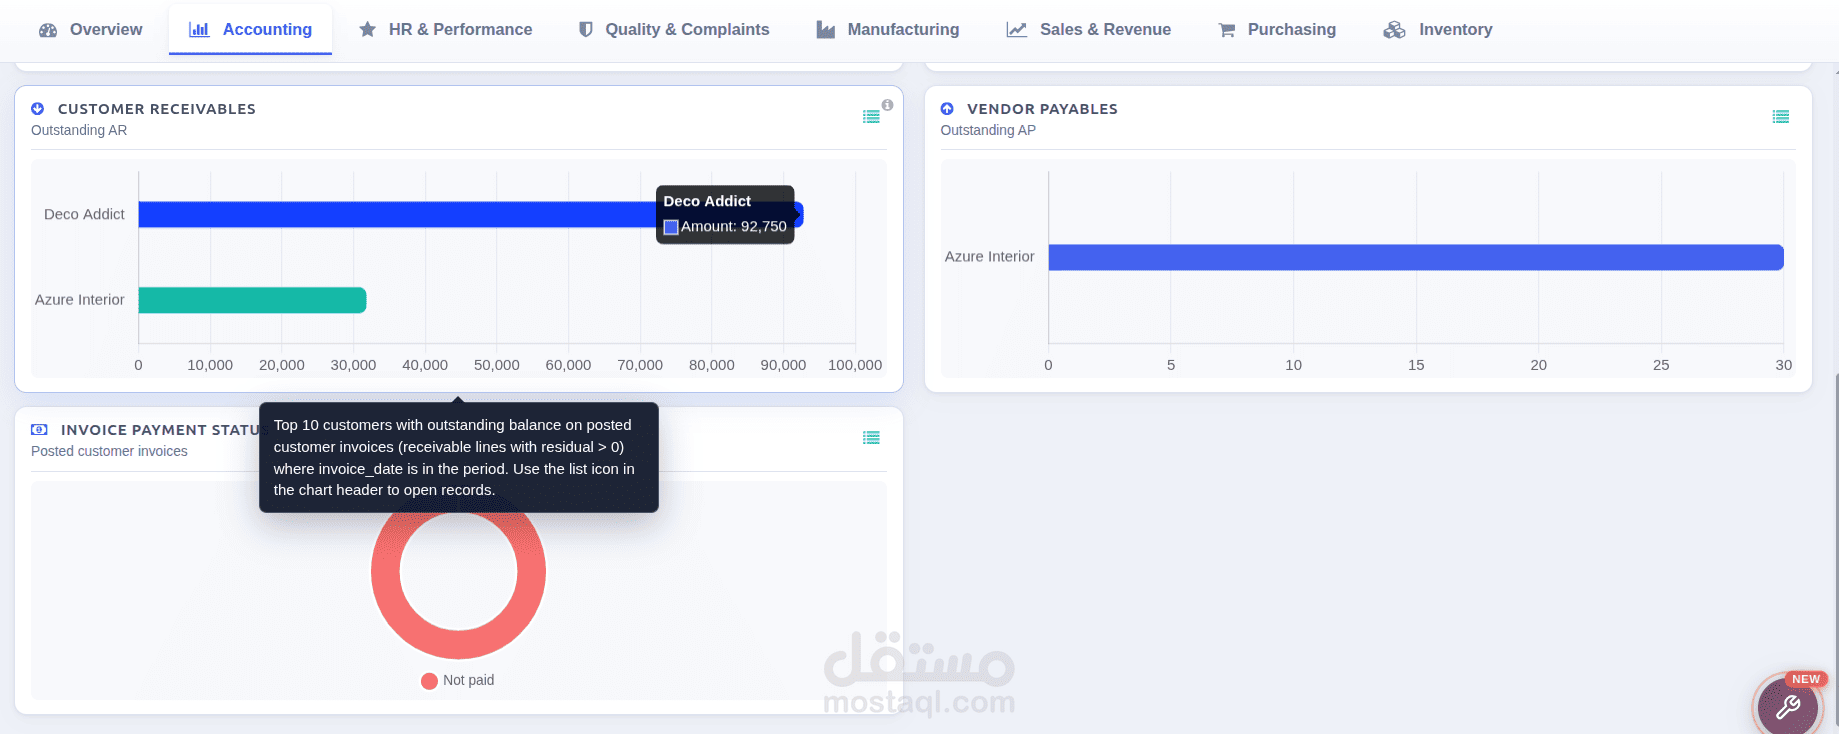
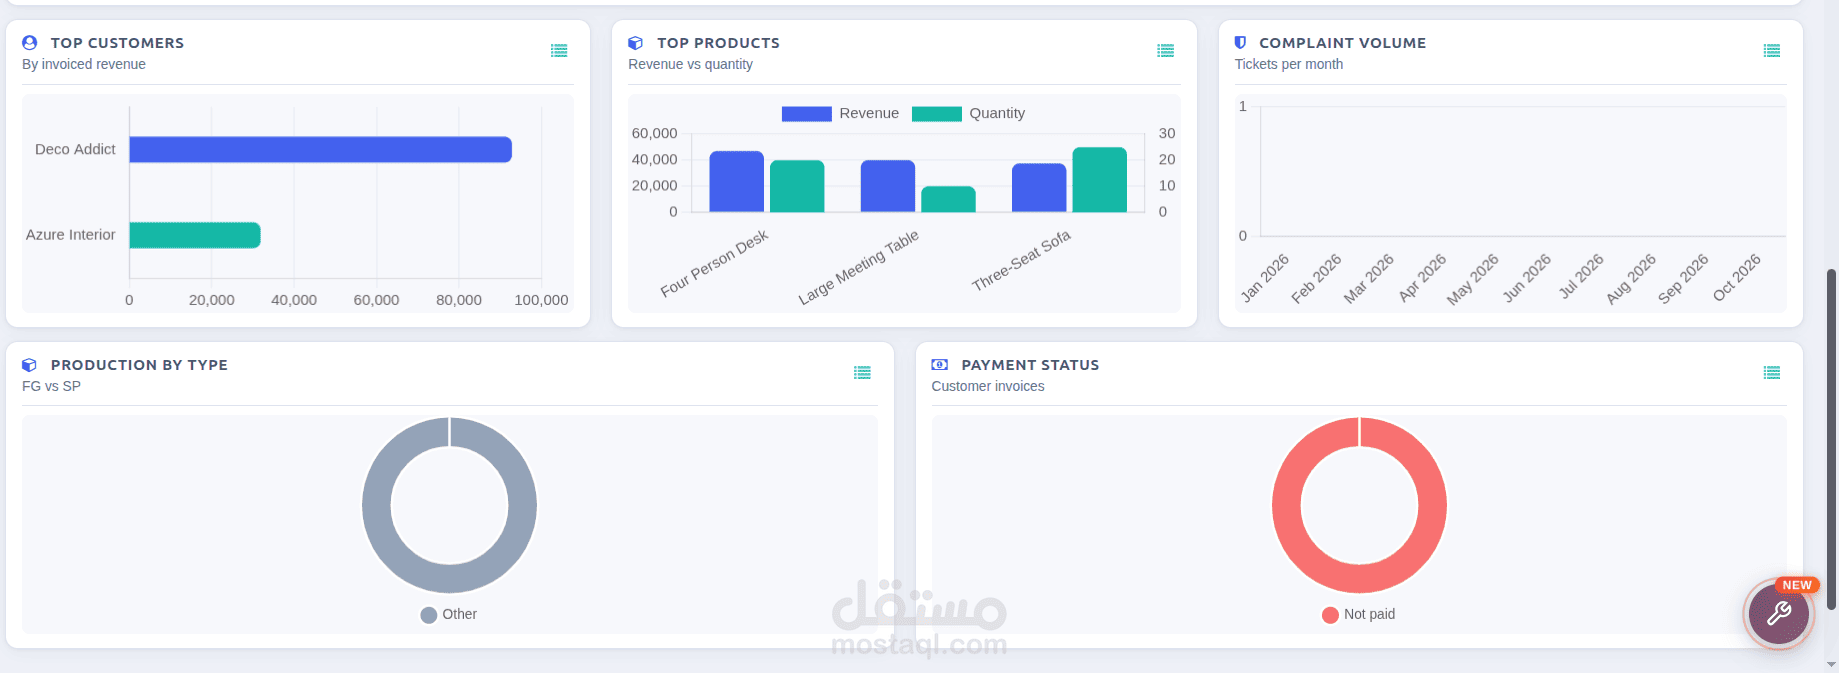
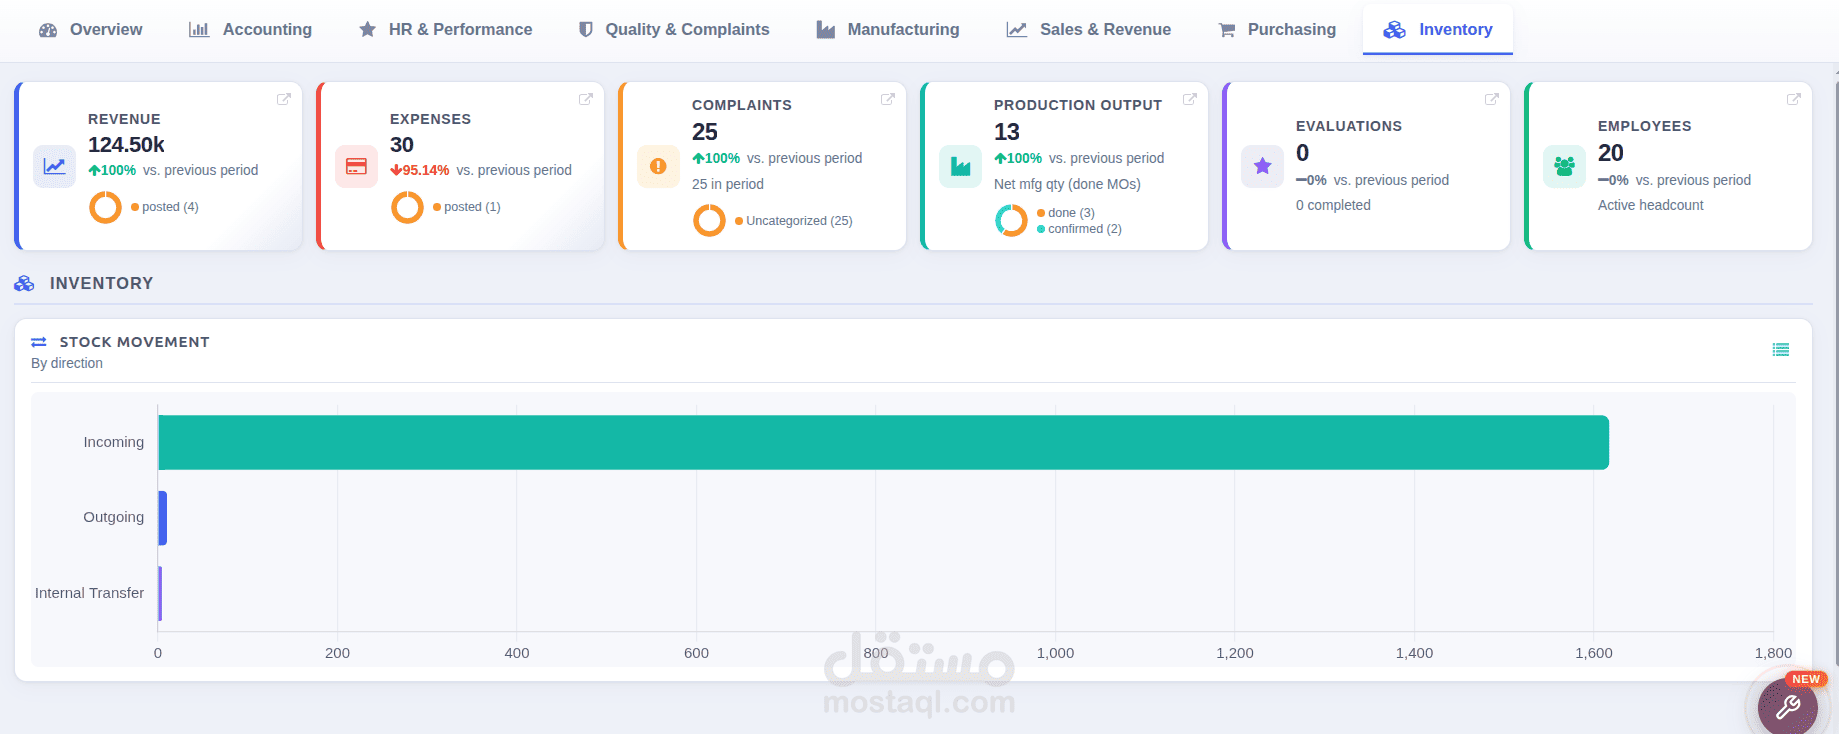
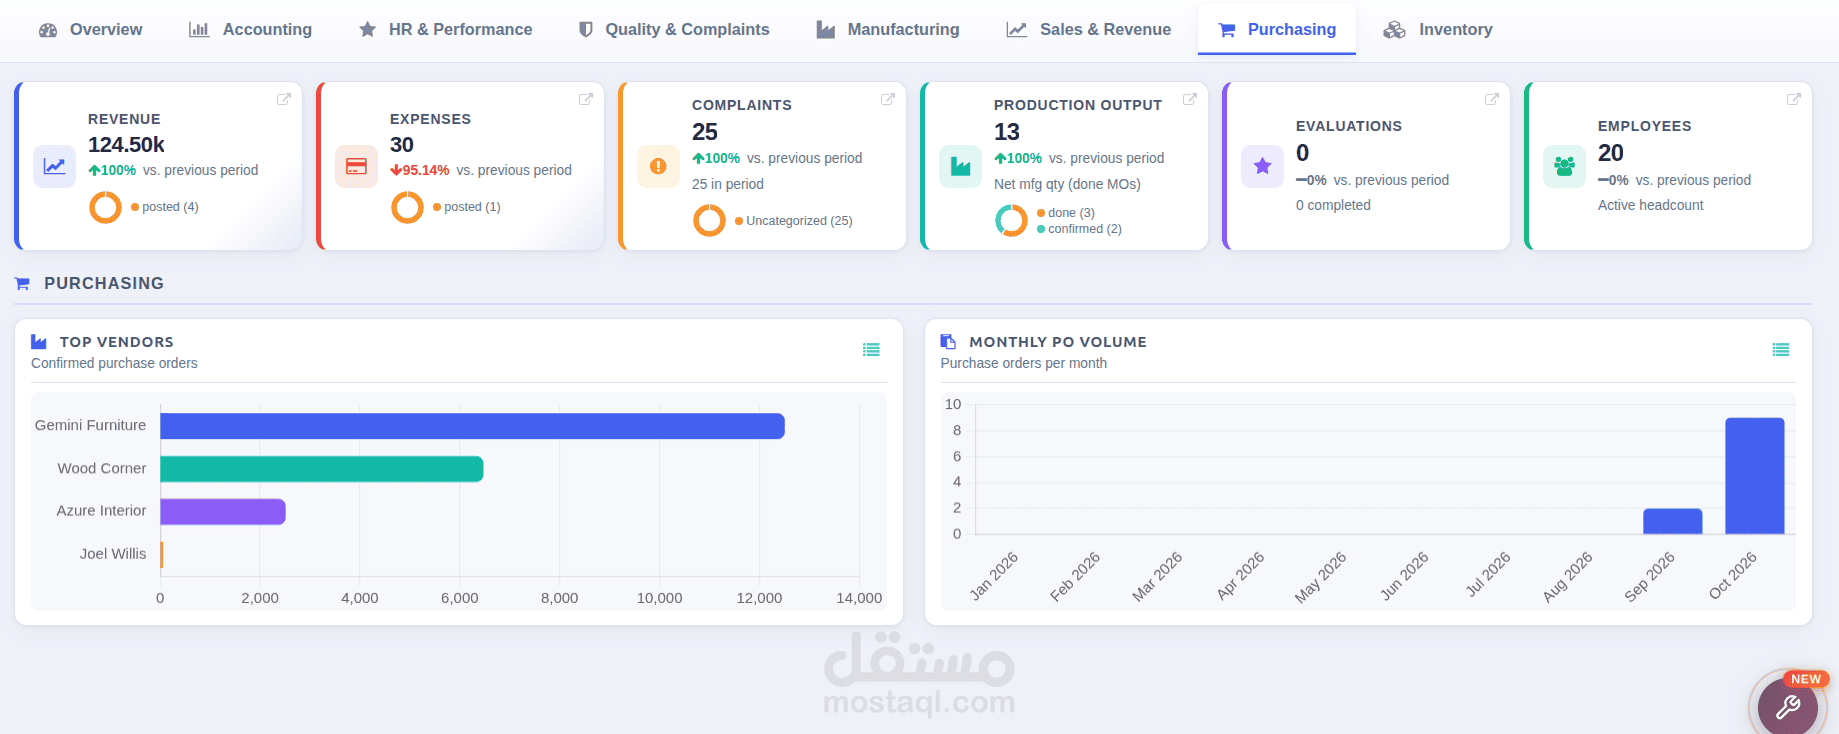
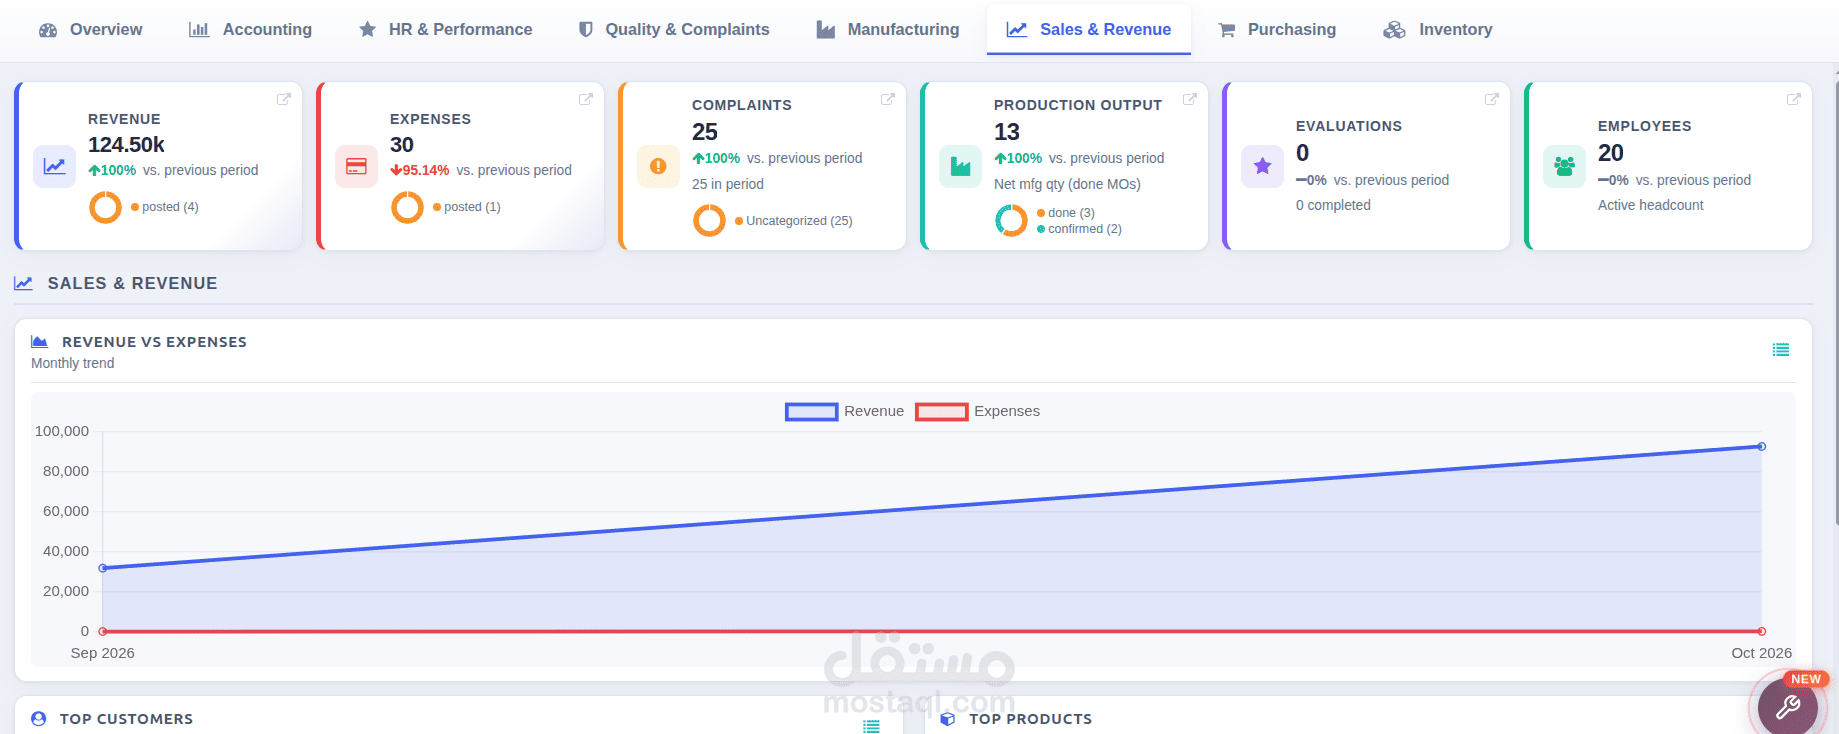
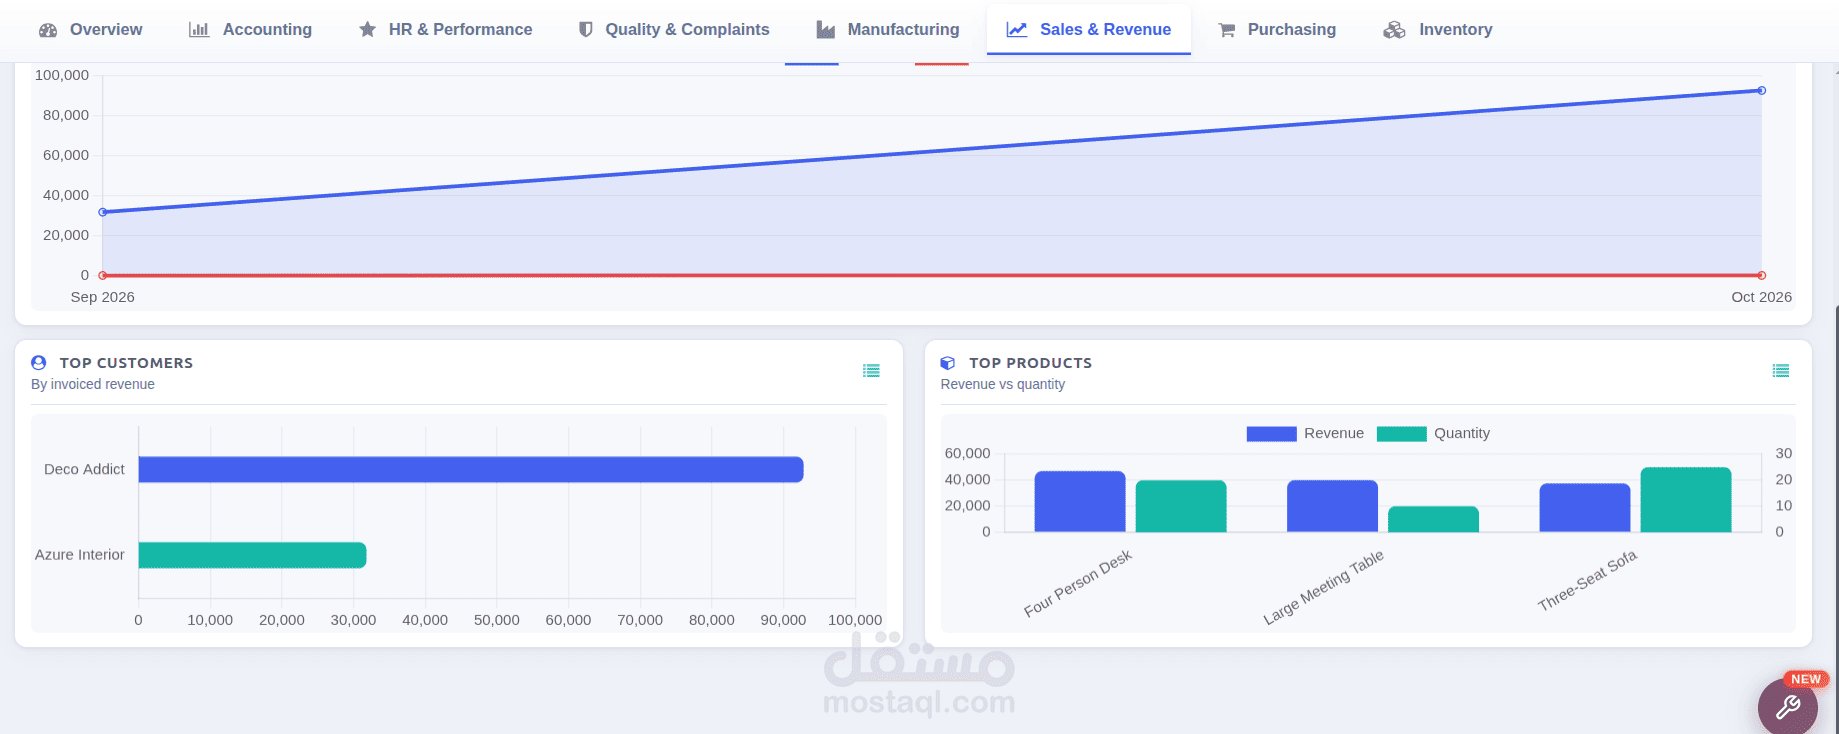
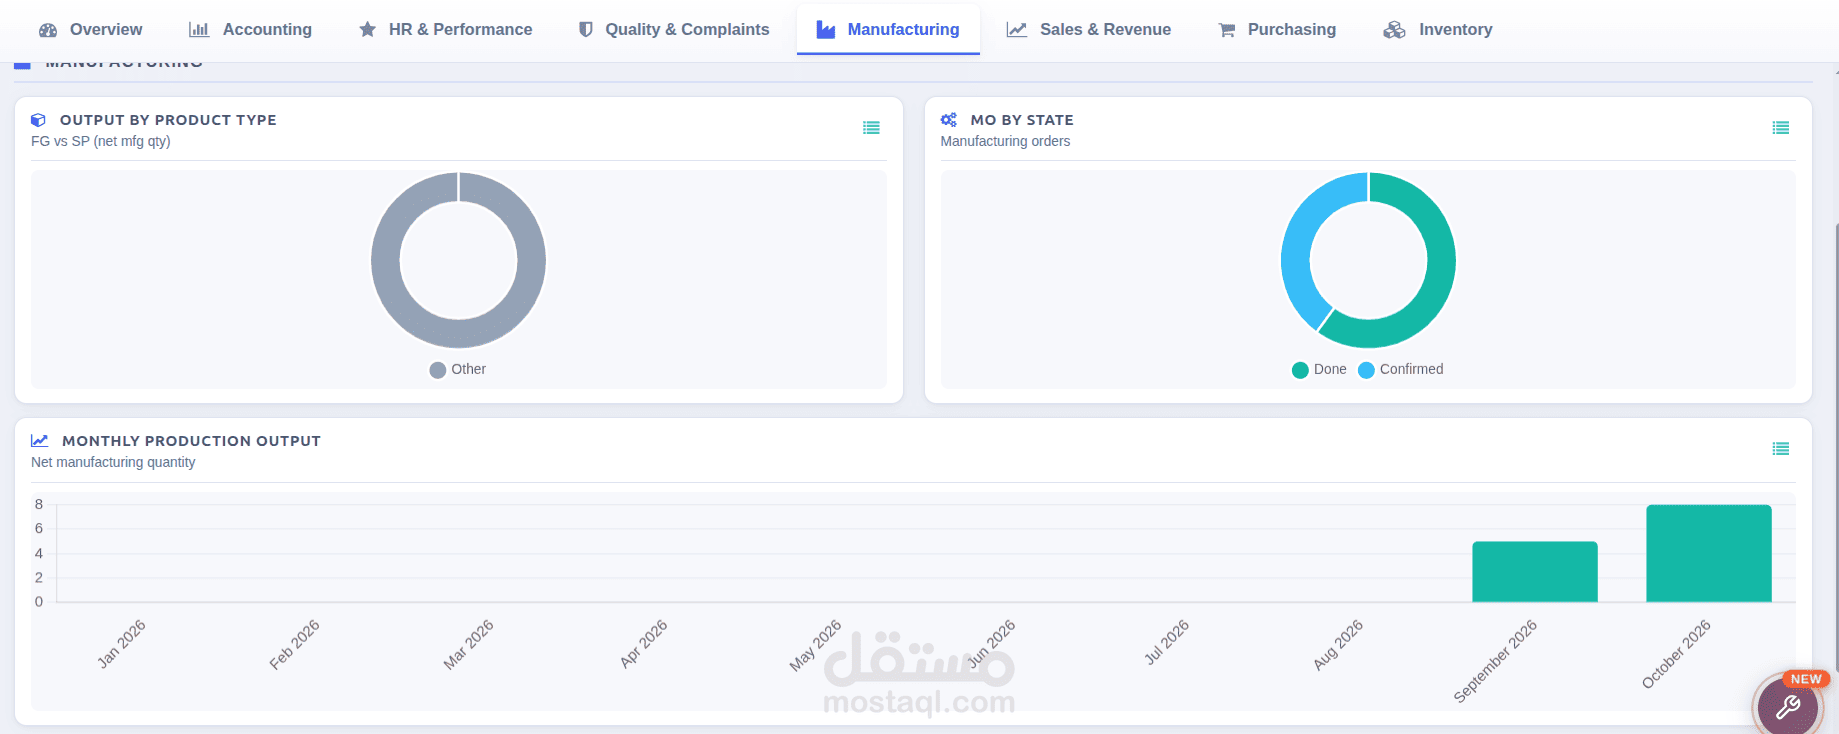
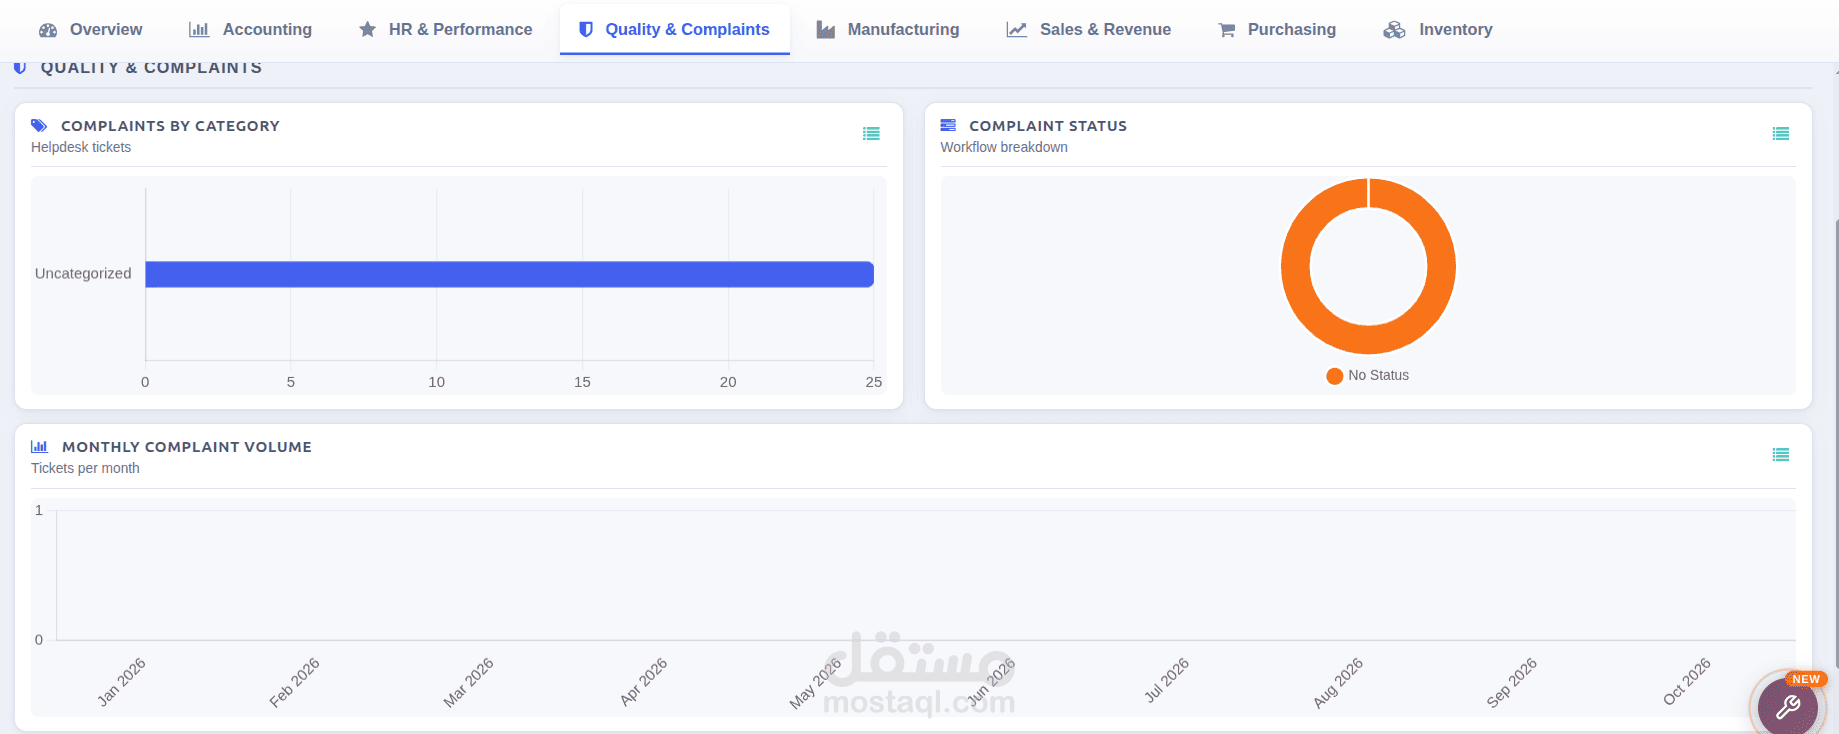
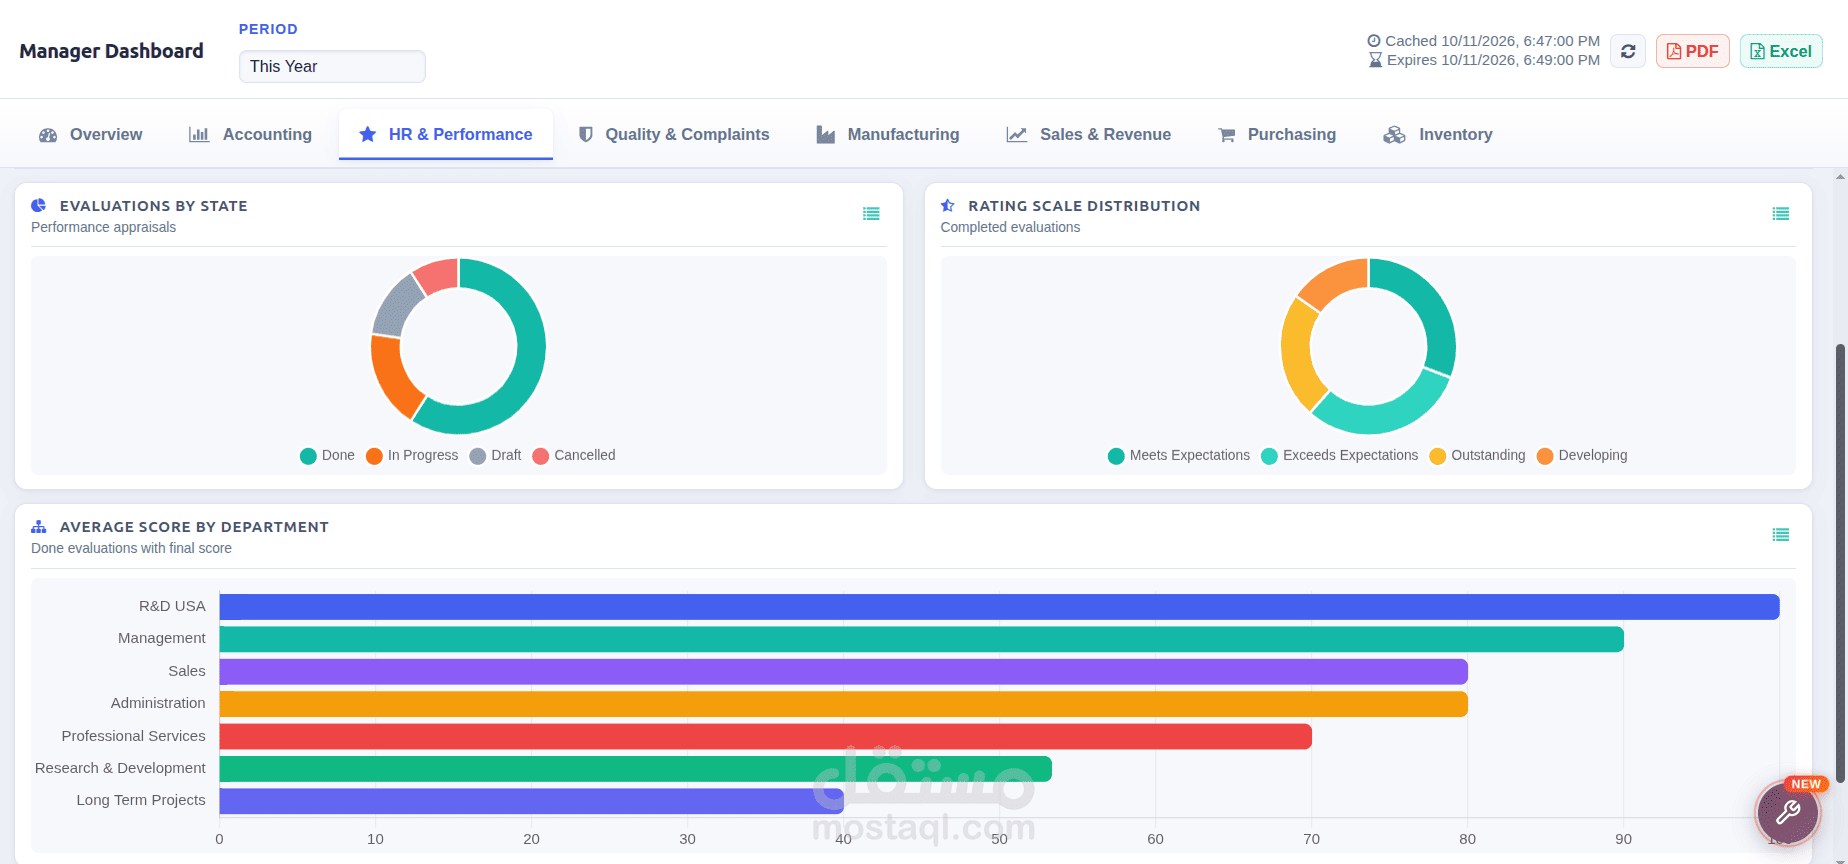
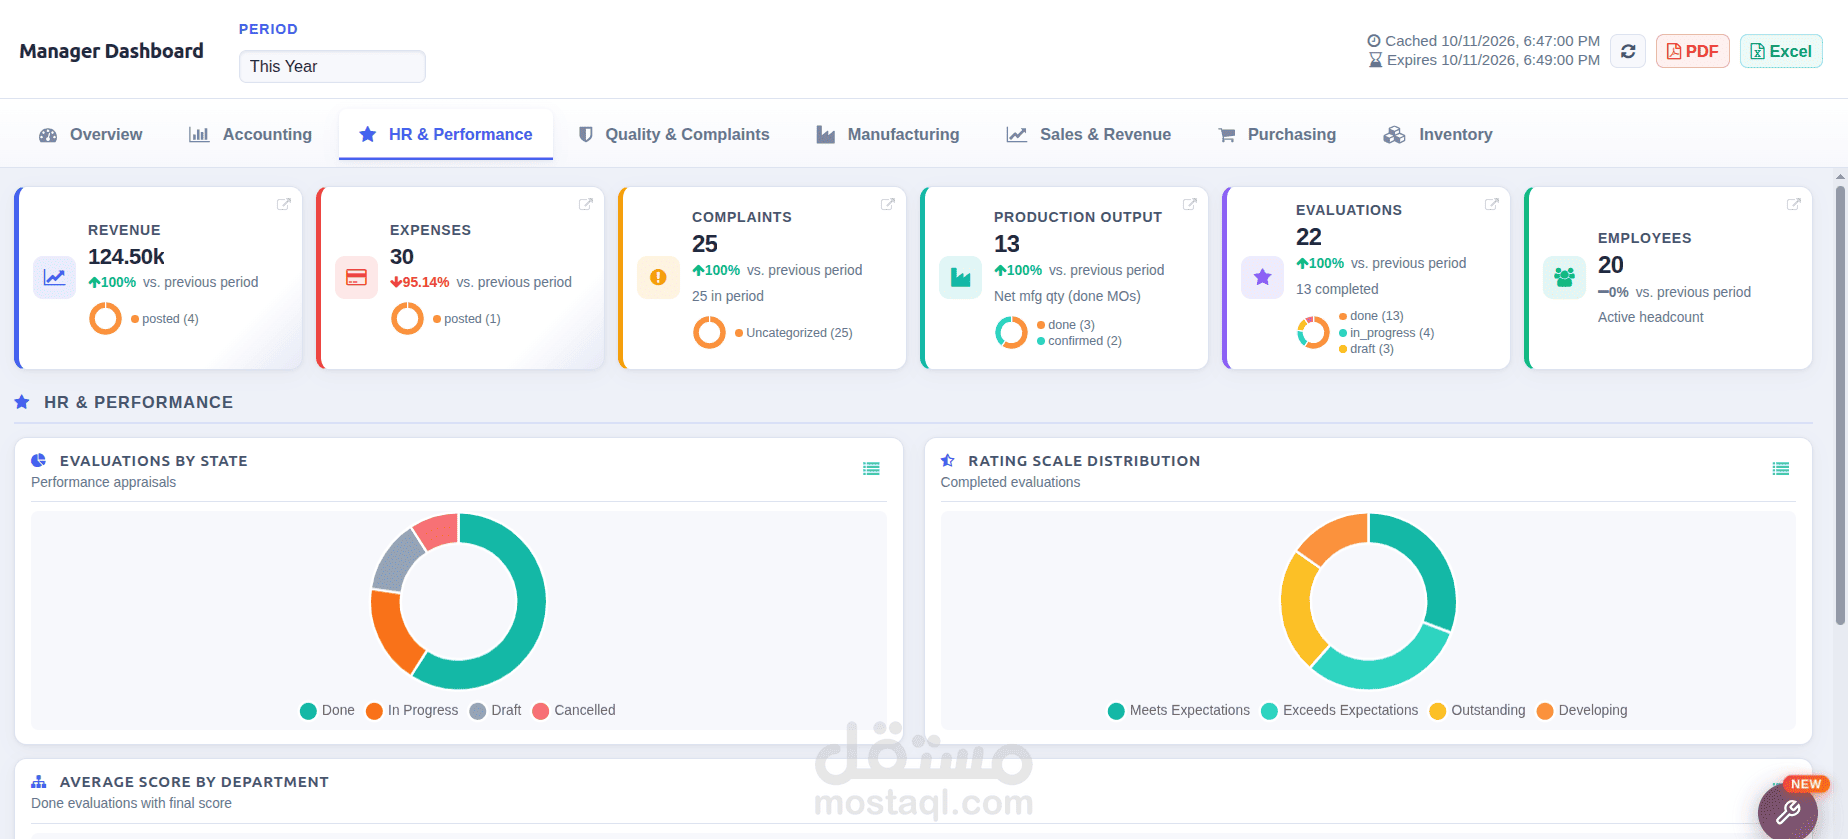
The Manager Dashboard is an operations overview for this company.
It pulls live numbers from accounting, sales, purchasing, inventory, manufacturing, helpdesk, and employee appraisals, and shows them as KPI cards and charts.
The top strip shows six figures for the selected period: revenue, expenses, complaints, production output, evaluations, and active employees, each compared with the previous period.
Overview covers revenue versus expenses, top customers and products, complaint volume, production by type, and invoice payment status. Accounting covers cash flow, the income statement, receivables, and payables. HR & Performance covers appraisals by state, rating scale, and average score by department. Quality & Complaints covers helpdesk tickets by category and status. Manufacturing covers output and manufacturing-order progress. Sales & Revenue, Purchasing, and Inventory cover customers, products, vendors, purchase orders, and stock movements. Use Period to change the date range. The list icon on a chart opens the underlying records. The refresh icon reloads the numbers, and PDF or Excel exports the current view.