Sales Performance Analysis
تفاصيل العمل
My Role: Data Analysis & Power BI Dashboard Development
Situation: Sales data needed to be analyzed to understand overall revenue, product category performance, regional sales distribution, and sales trends over time.
Task: Analyze total sales, identify the best-performing product categories, compare sales across different territories, and track yearly sales performance.
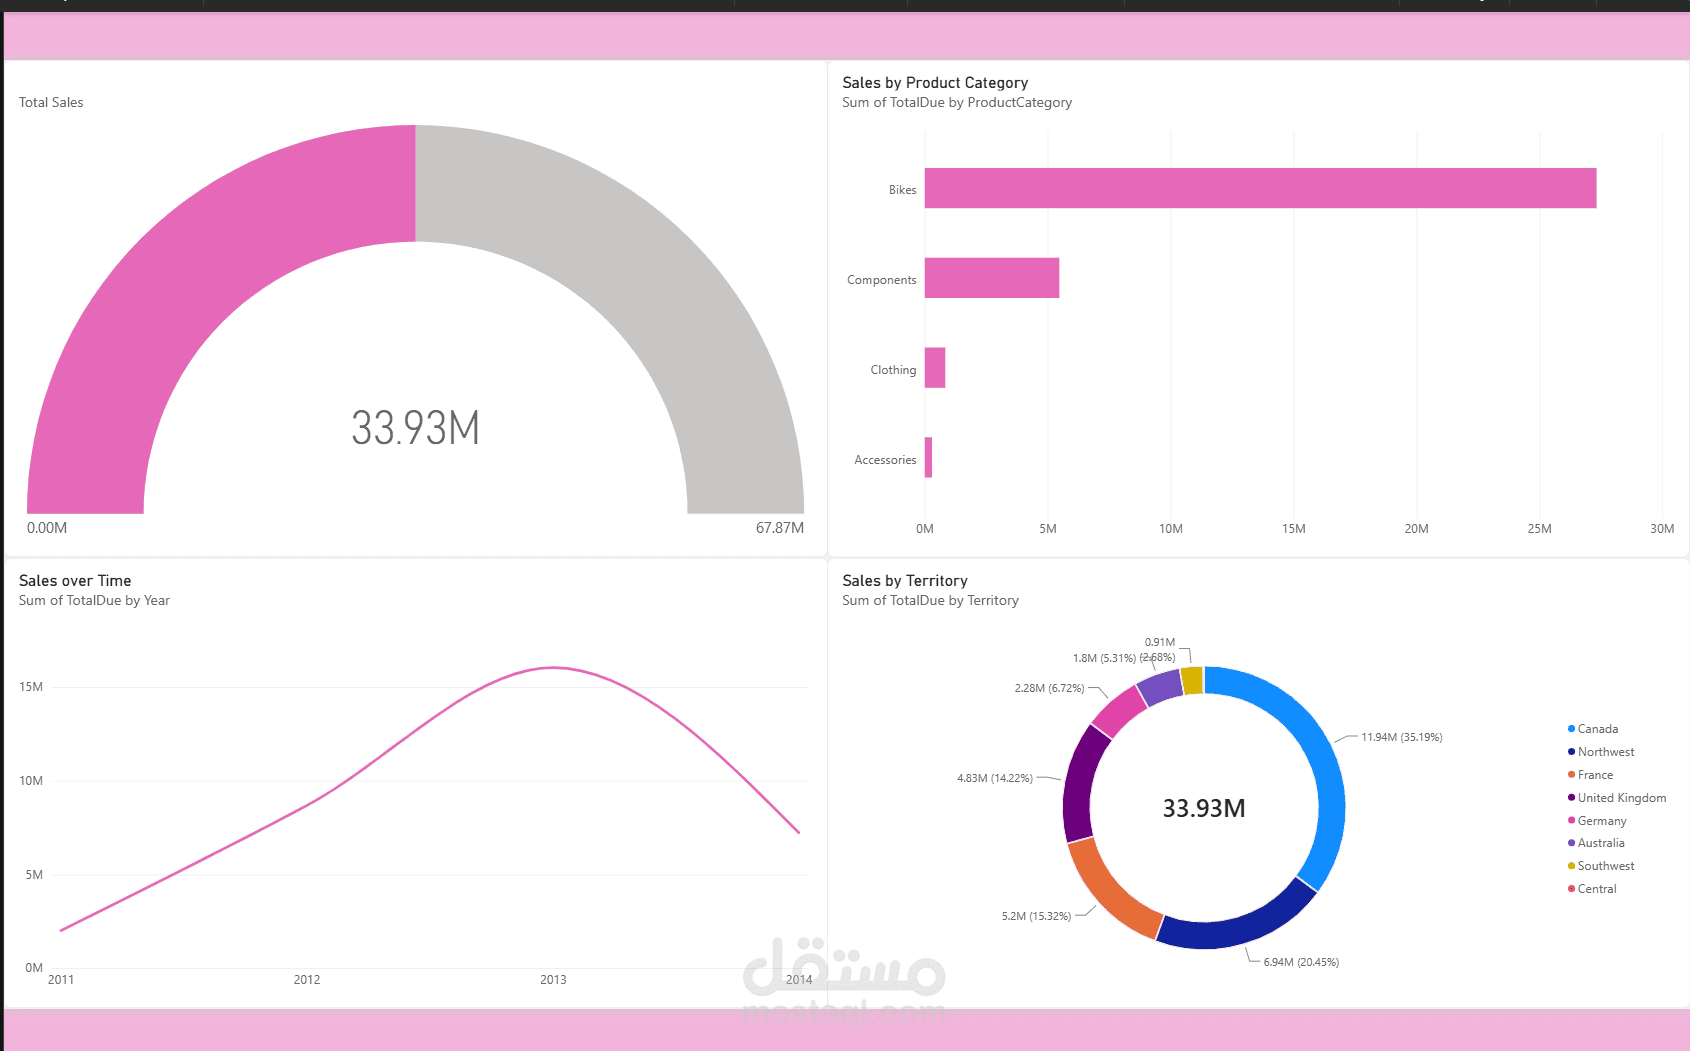
Action: Developed a Power BI dashboard using KPI visuals, bar charts, line charts, and donut charts to visualize sales performance by product category, territory, and year.
Result: Visualized 33.93M in total sales, identified Bikes as the leading product category, and highlighted Canada as the top sales territory with 35.19% of total sales. The dashboard also showed that sales peaked in 2013.
Tools & Technologies: Power BI, Data Analysis, Data Visualization.