Sales Data Analysis & EDA | Python, Pandas, Seaborn
تفاصيل العمل
Superstore Sales Data Analysis Using Python
Project Overview
This project focuses on analyzing retail sales data to uncover meaningful business insights, understand sales and profitability patterns, and support data-driven decision-making.
Tools & Technologies
* Python
* Pandas & NumPy
* Matplotlib & Seaborn
* Jupyter Notebook
Project Workflow
1. Data Exploration & Inspection
Explored the dataset structure, columns, data types, and descriptive statistics.
Examined missing values and duplicate records.
2. Data Cleaning & Preparation
* Investigated missing values, duplicate records, and outliers.
* Prepared the dataset for further analysis.
* Exported cleaned and processed datasets.
3. Feature Engineering
* Created additional analytical features, including profit margin, shipping duration, and sales performance categories.
4. Exploratory Data Analysis (EDA)
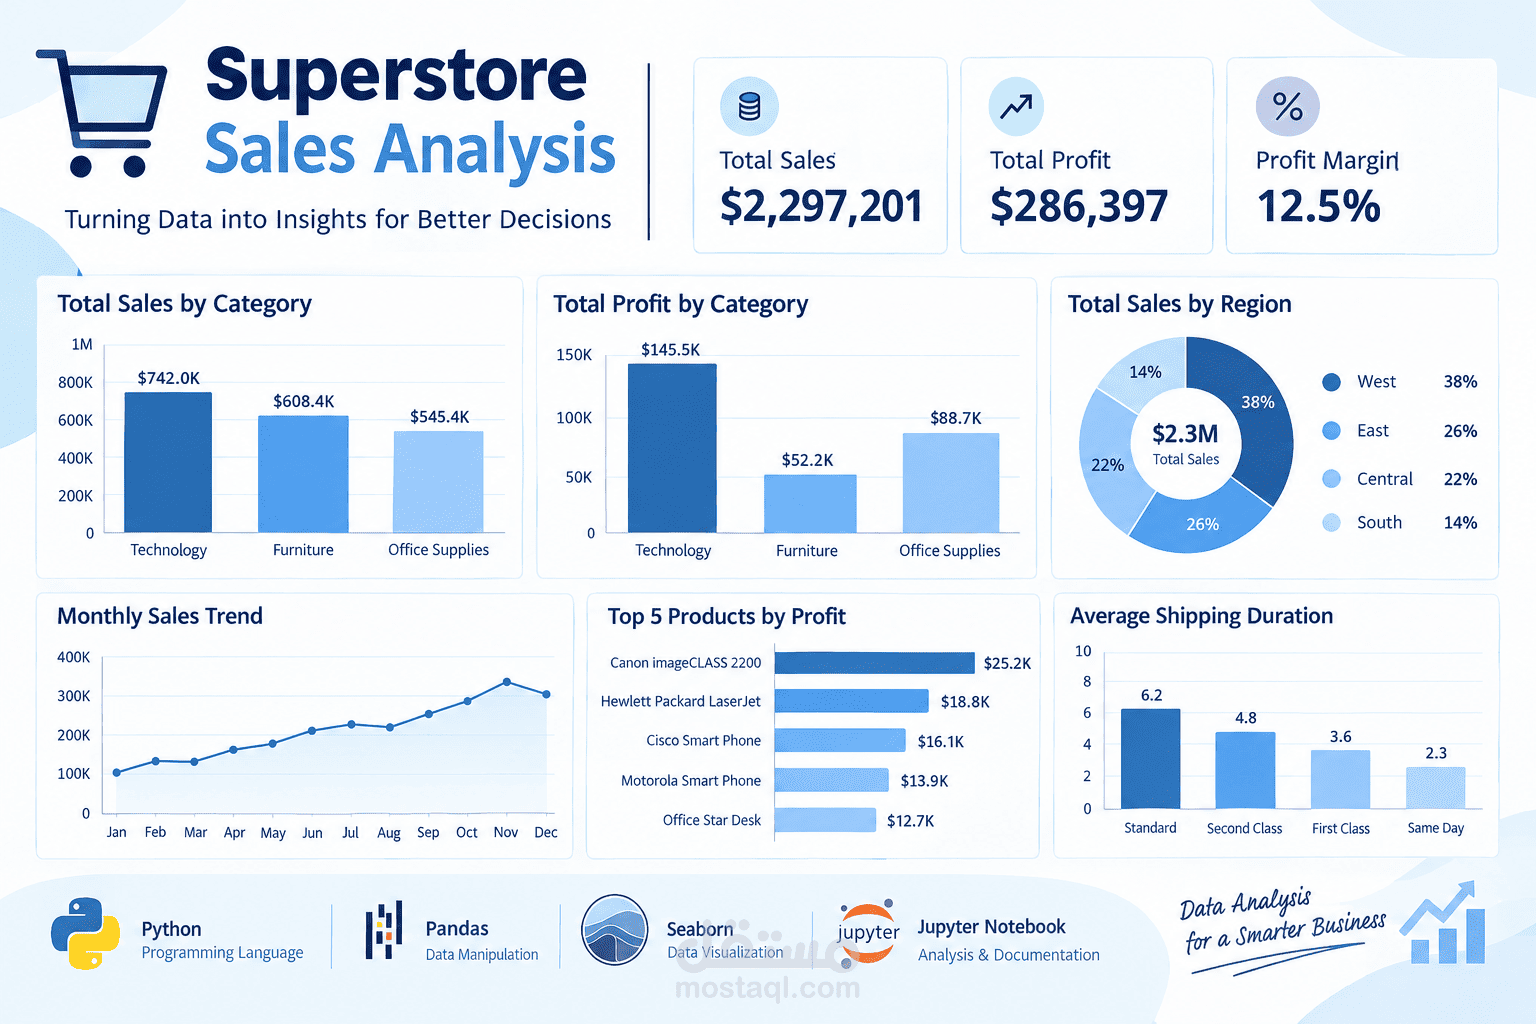
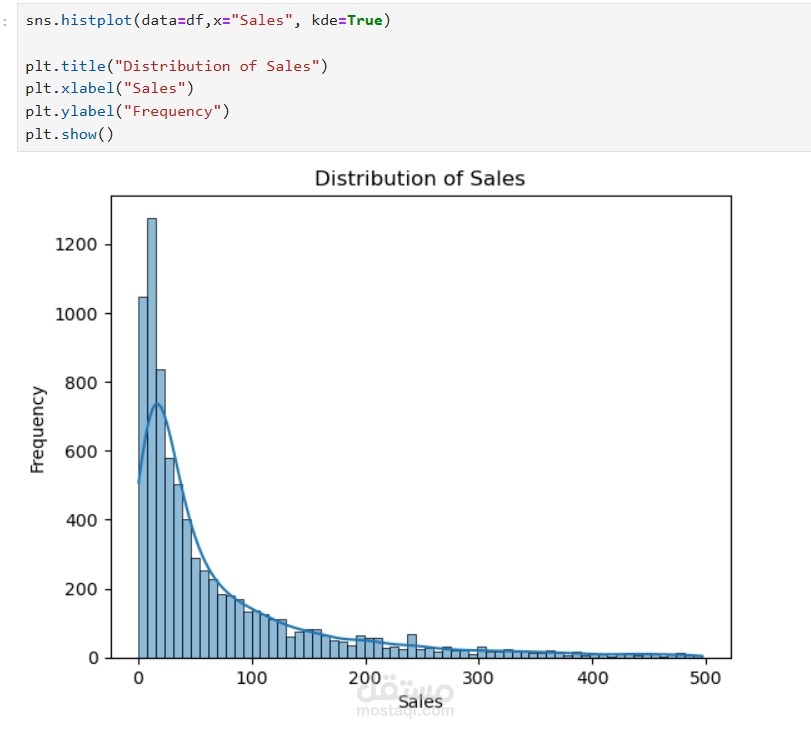
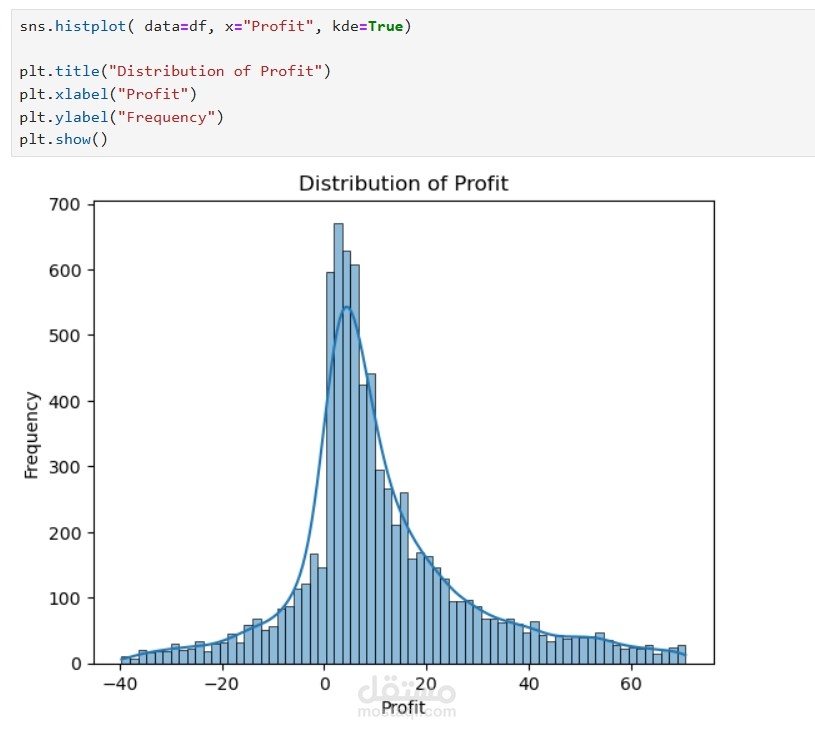
* Analyzed sales and profit distributions.
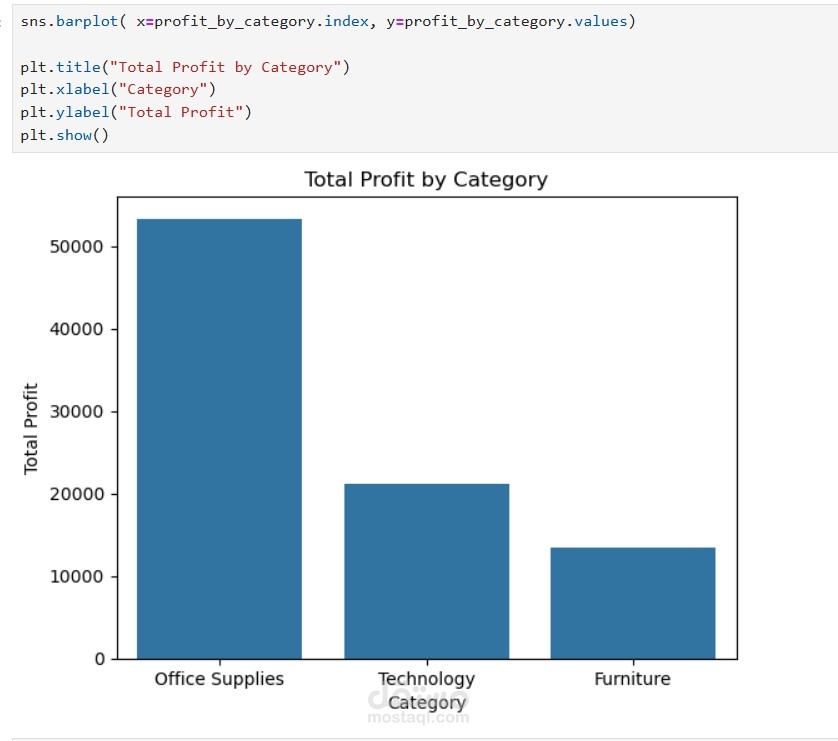
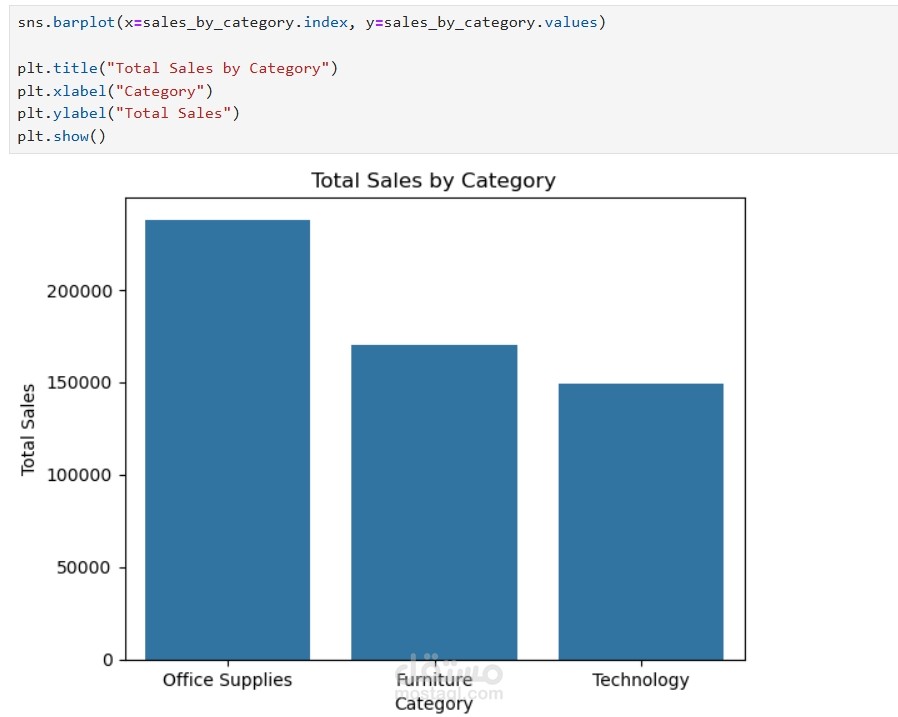
* Compared sales and profitability across product categories, regions, and customer segments.
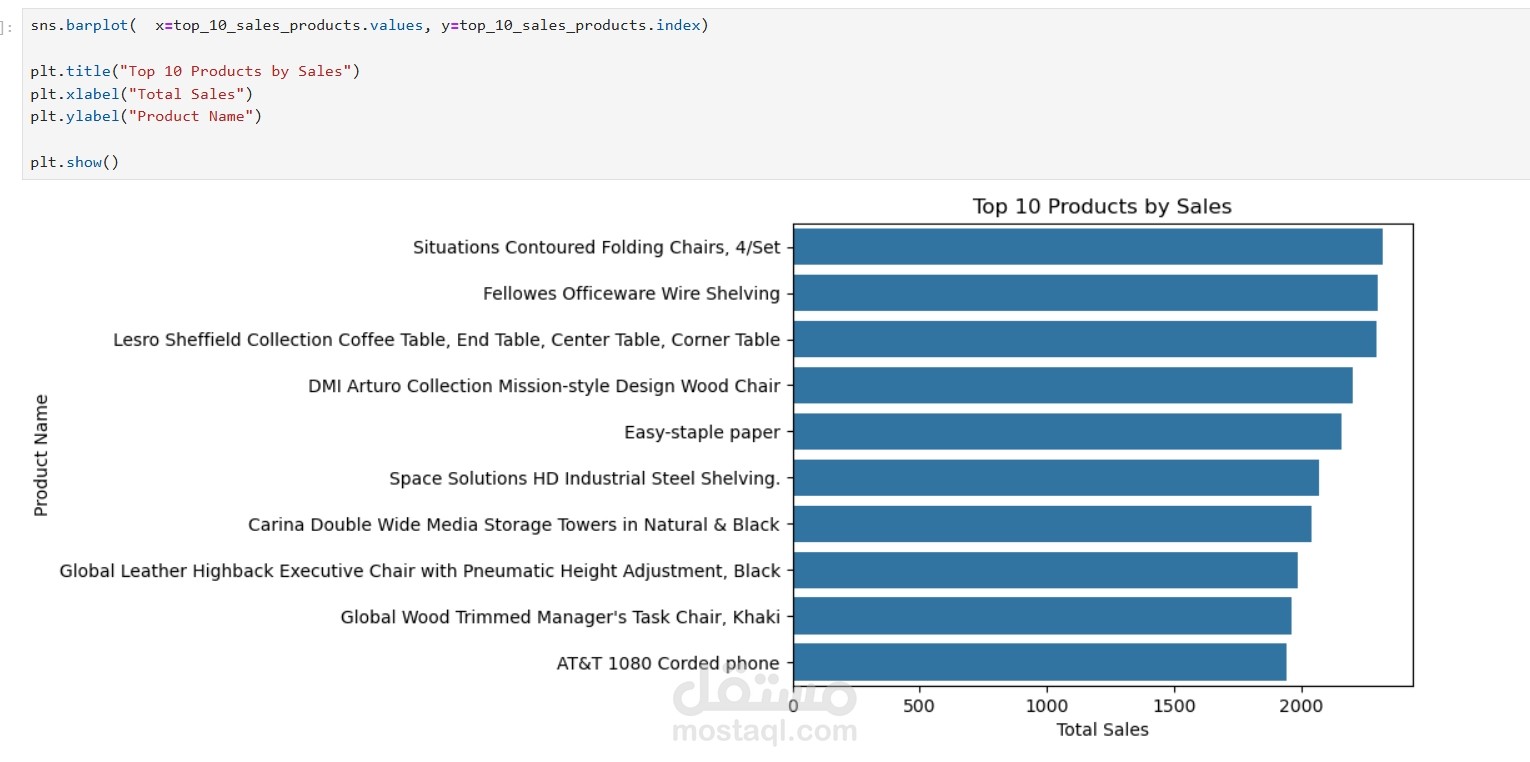
* Identified top-performing products by sales and profit.
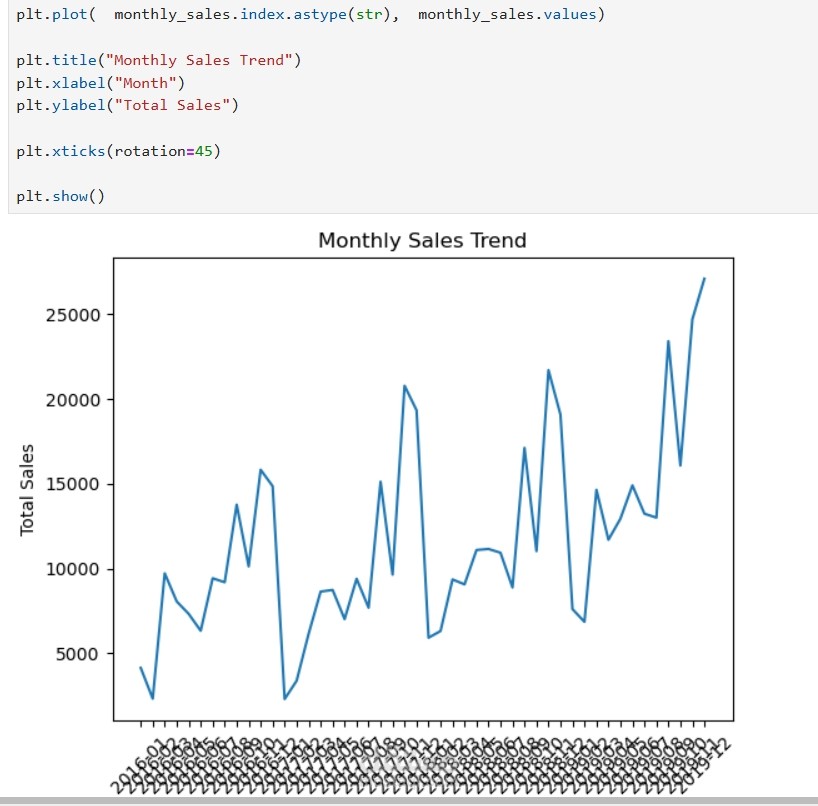
* Analyzed monthly sales trends.
* Examined average shipping duration across shipping methods.
5. KPI Analysis & Business Insights
* Developed a reusable Python class to calculate key performance indicators.
* Analyzed total sales, total profit, profit margin, order and customer counts, average order value, and shipping duration.
* Generated an analytical summary and business insights.
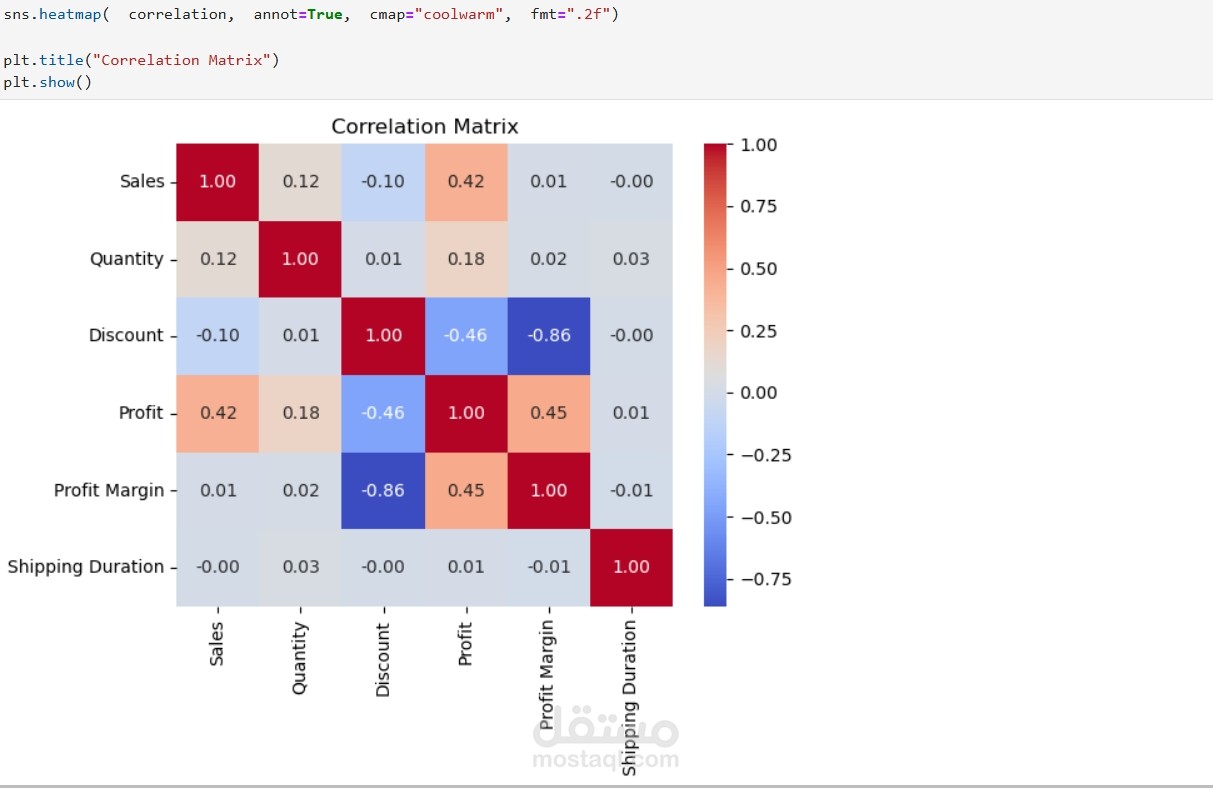
* Examined correlations between numerical variables.
Deliverables
* Jupyter Notebook containing the analysis workflow.
* Cleaned and feature-engineered datasets.
* Data visualizations and KPI summaries.
* Business insights derived from the analysis.
Project Objective
To transform raw retail data into structured, meaningful insights that help businesses understand their performance, identify sales opportunities, and make better-informed decisions.