Trending YouTube Video Statistics
تفاصيل العمل
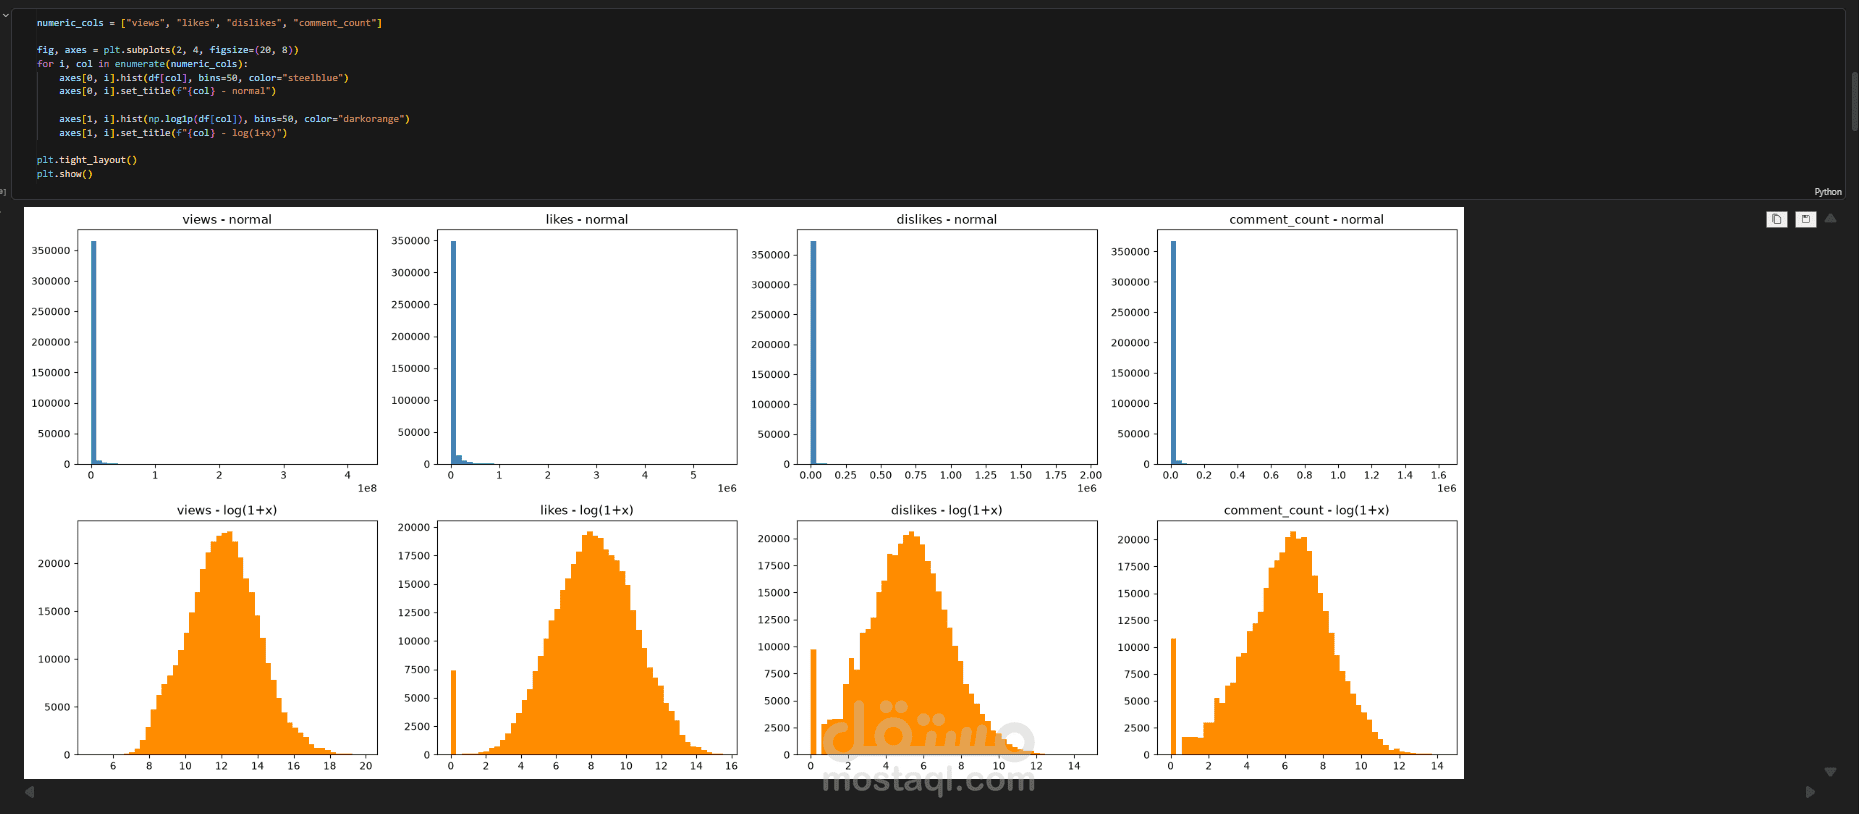
To explore the distribution of the key engagement metrics in the YouTube Trending Videos dataset, I visualized four numeric features (views, likes, dislikes, and comment count) using a 2×4 grid of histograms, comparing raw values against log-transformed values (log(1+x) via np.log1p). The raw distributions were heavily right-skewed, with the vast majority of videos clustered near zero and a small number of viral outliers reaching millions of interactions, which masked any meaningful structure in the data. Applying the logarithmic transformation normalized these distributions into near-symmetric, bell-shaped curves, revealing the underlying patterns and making the features far better suited to statistical modeling and machine learning algorithms that assume normality. The analysis also uncovered a distinct spike at zero in likes, dislikes, and comment count, indicating videos with disabled ratings or comments, an insight that informed my data preprocessing and feature engineering decisions.