Jira Manager Pro – Ticket Analytics Dashboard
تفاصيل العمل
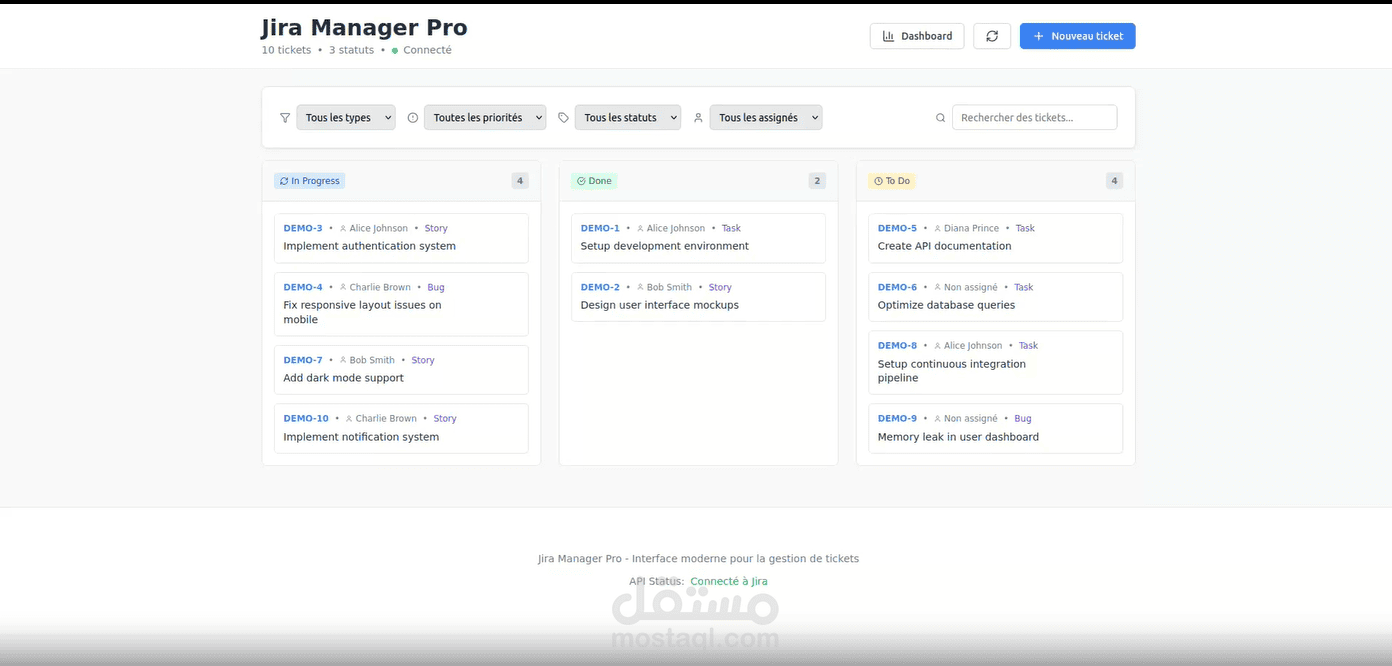
Analytics dashboard built during my data-analyst internship at Primatec Engineering (KPIT). A Flask backend pulls tickets from the Jira API and computes the KPIs a team lead needs: mean resolution time, weekly throughput, high-priority backlog and volume trends. It breaks the backlog down by priority, type and assignee, flags peak-load weeks, and ranks its own findings by severity, so the dashboard states its conclusions instead of leaving you to read them off charts. A React + Recharts front end handles ticket management and filtering. It is now used internally at KPIT.