Customer Data Analysis and Visualization Using Python
تفاصيل العمل
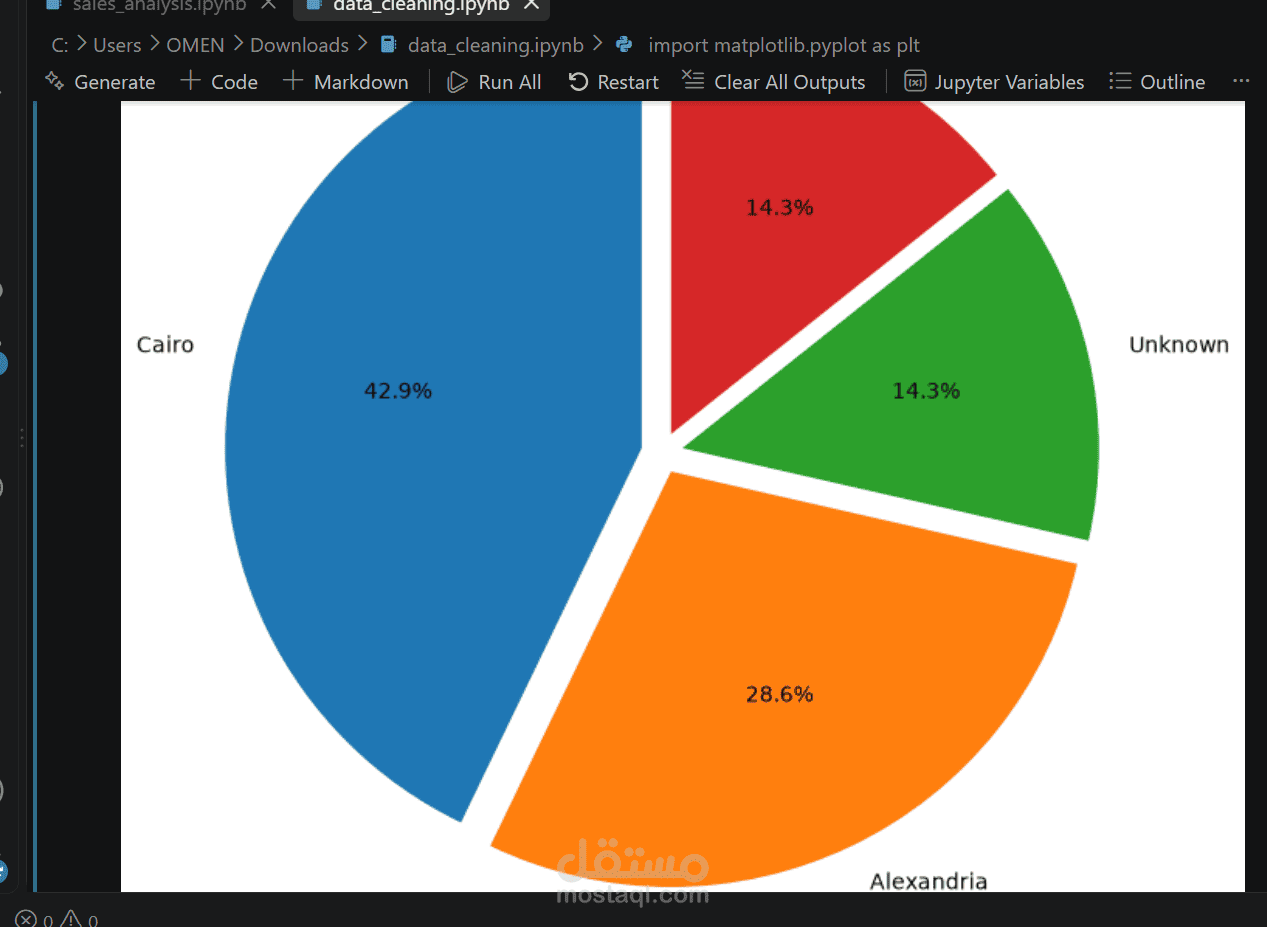
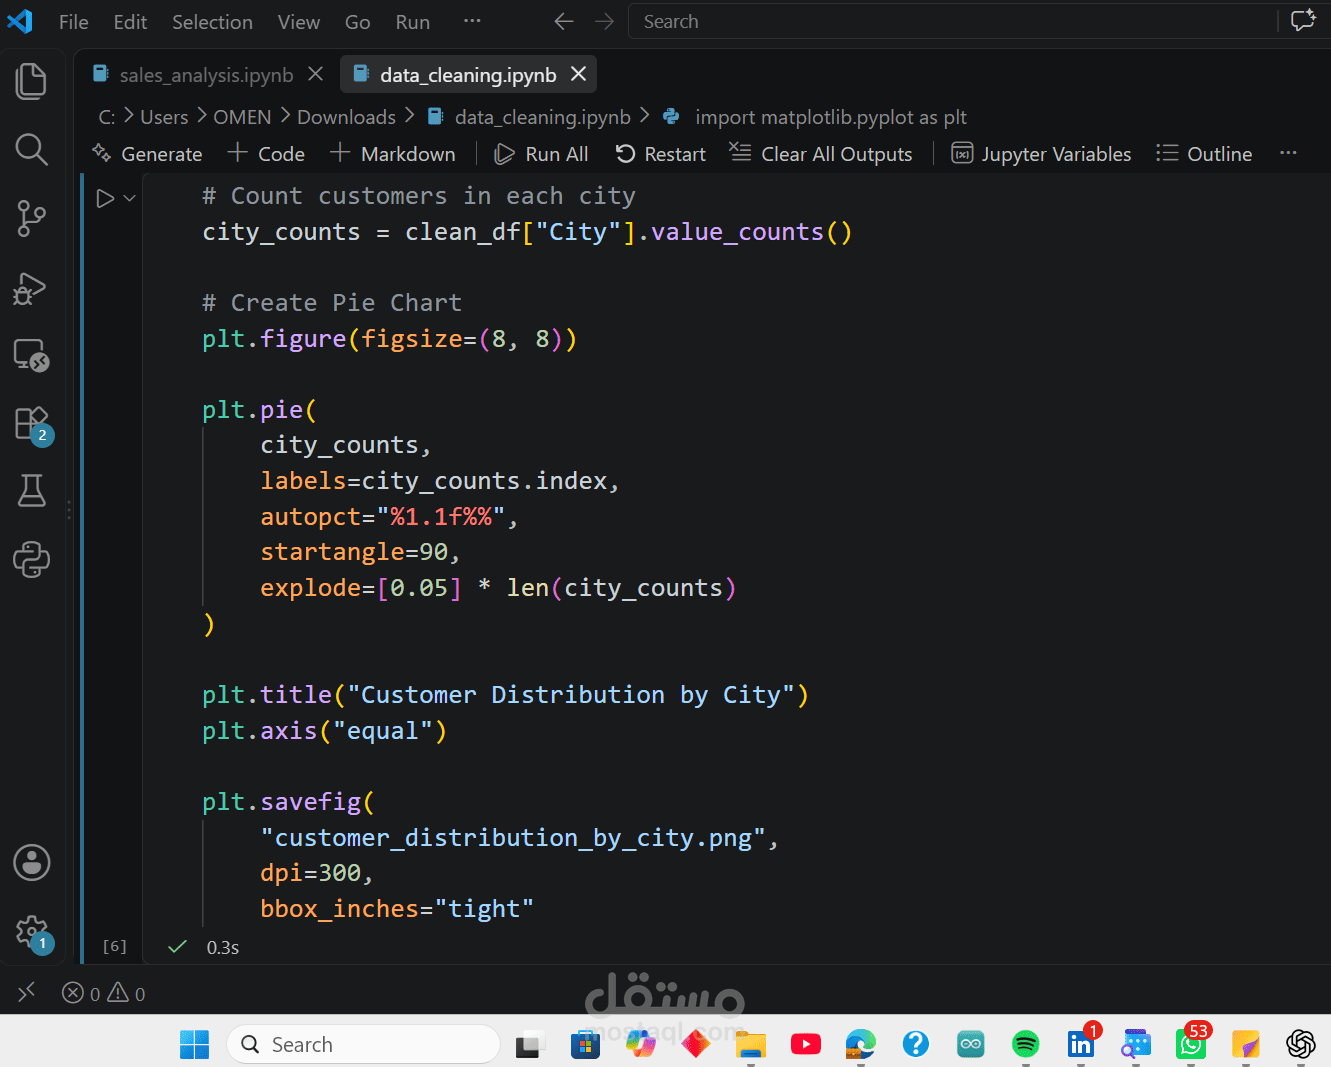
Customer Distribution Analysis Using Python
This project visualizes customer distribution across different cities using Python and Pandas.
Tools Used:
Python
Pandas
Matplotlib
Project Features:
Analyzing customer data by city.
Calculating the number of customers in each city.
Creating a Pie Chart to visualize customer distribution.
Displaying percentages for each city.
Saving the chart as a high-resolution PNG image.
Note: This project uses a sample dataset for educational and demonstration purposes.