Schedule & Attendance Analytics Dashboard
تفاصيل العمل
Project Overview
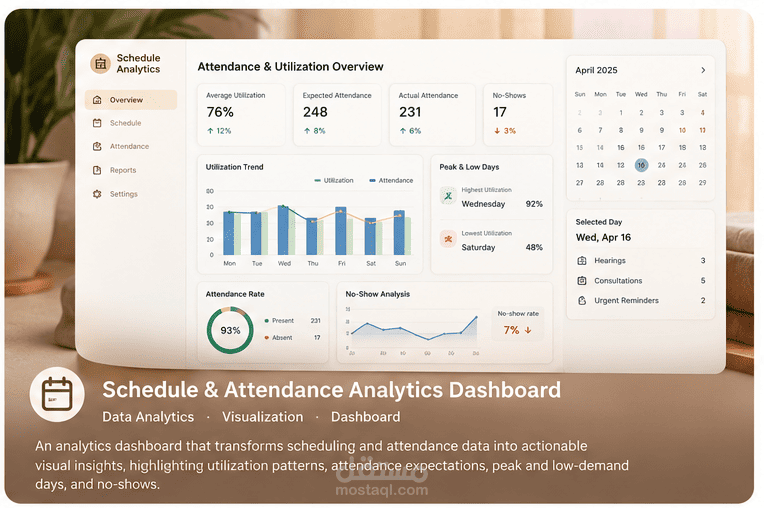
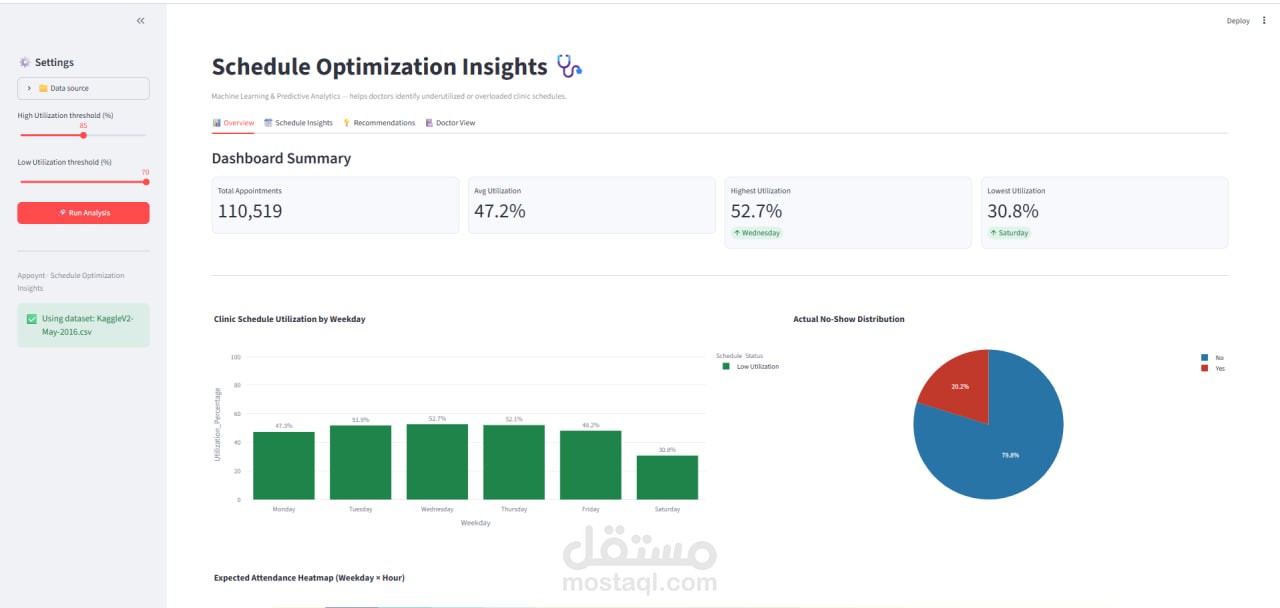
An analytics dashboard designed to analyze schedule utilization and attendance patterns.
The dashboard transforms scheduling and attendance information into visual indicators that help identify utilization levels, attendance expectations, and no-show behavior.
Problem
Raw scheduling and attendance data can make it difficult to quickly understand:
Which days are highly utilized?
Which days have low utilization?
What is the expected attendance?
How many people actually attend?
Where are the no-show patterns?
The dashboard organizes these indicators into a visual analytics interface.
My Work
Analyzed scheduling and attendance data.
Identified peak utilization days.
Identified low utilization days.
Calculated/represented average utilization.
Highlighted highest and lowest utilization levels.
Presented expected attendance information.
Included no-show information.
Organized the metrics into an easy-to-read dashboard.
Dashboard Analytics
The dashboard focuses on several important indicators:
Utilization
Average utilization
Highest utilization
Lowest utilization
Peak days
Low-utilization days
Attendance
Expected attendance
Actual attendance patterns
No-Shows
Attendance gaps
No-show behavior
Technical Approach
Schedule Data
↓
Data Processing
↓
Utilization Analysis
↓
Attendance Analysis
↓
No-Show Analysis
↓
Dashboard Visualization
Technologies
Data Analytics
Dashboard Design
Data Visualization
Python / Data Processing (only if you want to list Python here, we should verify the original project source first)
Key Features
Utilization overview
Peak-day identification
Low-utilization identification
Average utilization
Highest utilization
Lowest utilization
Expected attendance
No-show analytics
Visual KPI presentation