Tips Dataset — Exploratory Data Analysis
تفاصيل العمل
Project Overview
Performed an exploratory data analysis on the Tips dataset to understand customer spending behavior and identify relationships between total bills, tips, time, gender, smoking status, and party size.
Work Performed
Loaded and explored the dataset using Python and Pandas.
Analyzed data types, dataset structure, and statistical summaries.
Checked data quality and missing values.
Analyzed the distribution of total bills and tips.
Investigated the relationship between total bill and tip amount.
Compared tipping behavior across different days and meal times.
Analyzed differences in tips based on gender and smoking status.
Examined the effect of party size on total bills and tips.
Used correlation analysis to identify relationships between numerical variables.
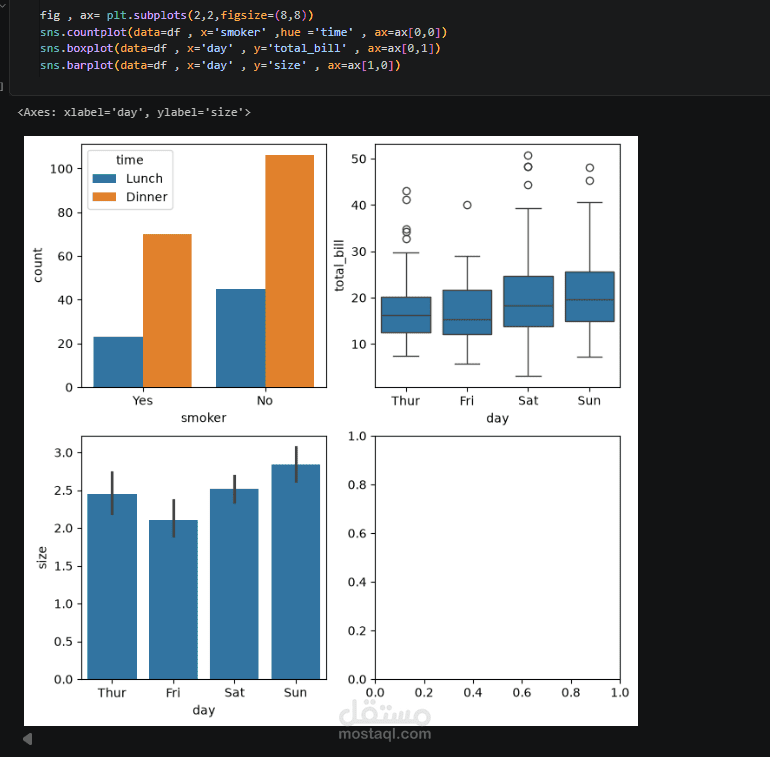
Created informative visualizations using Matplotlib and Seaborn.
Extracted insights and patterns from customer tipping behavior.