Goodreads Books Analysis
تفاصيل العمل
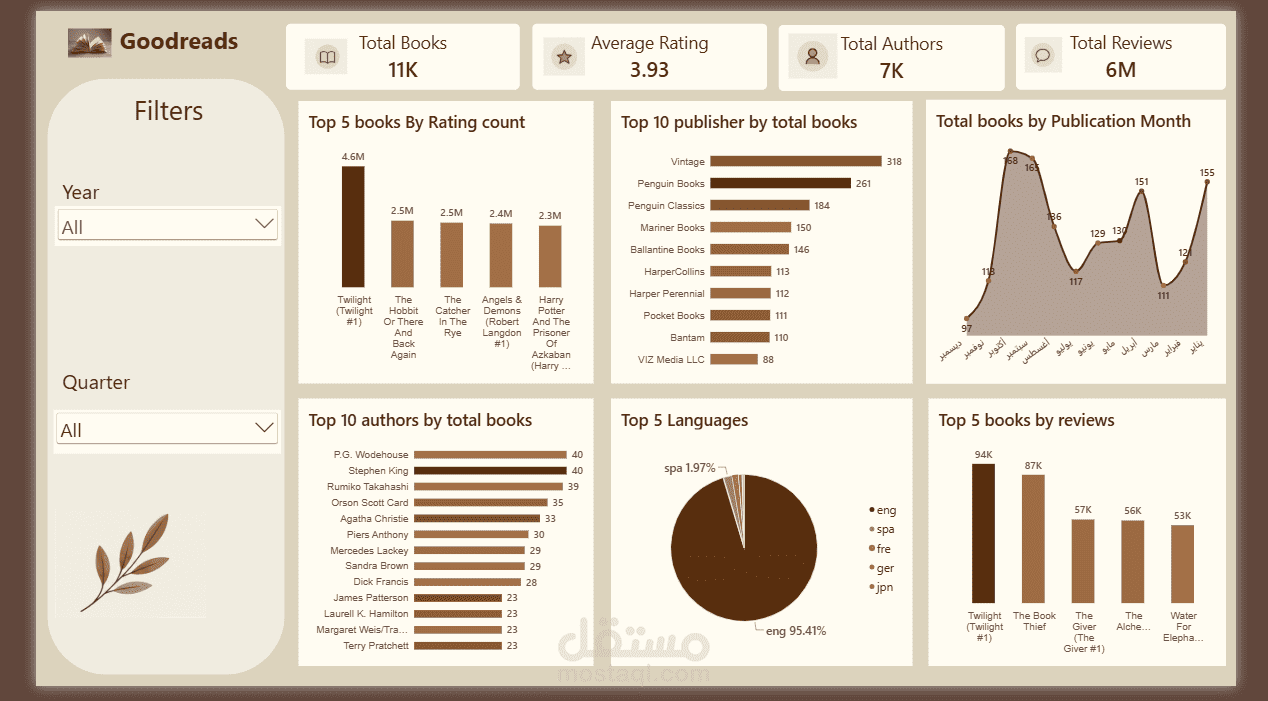
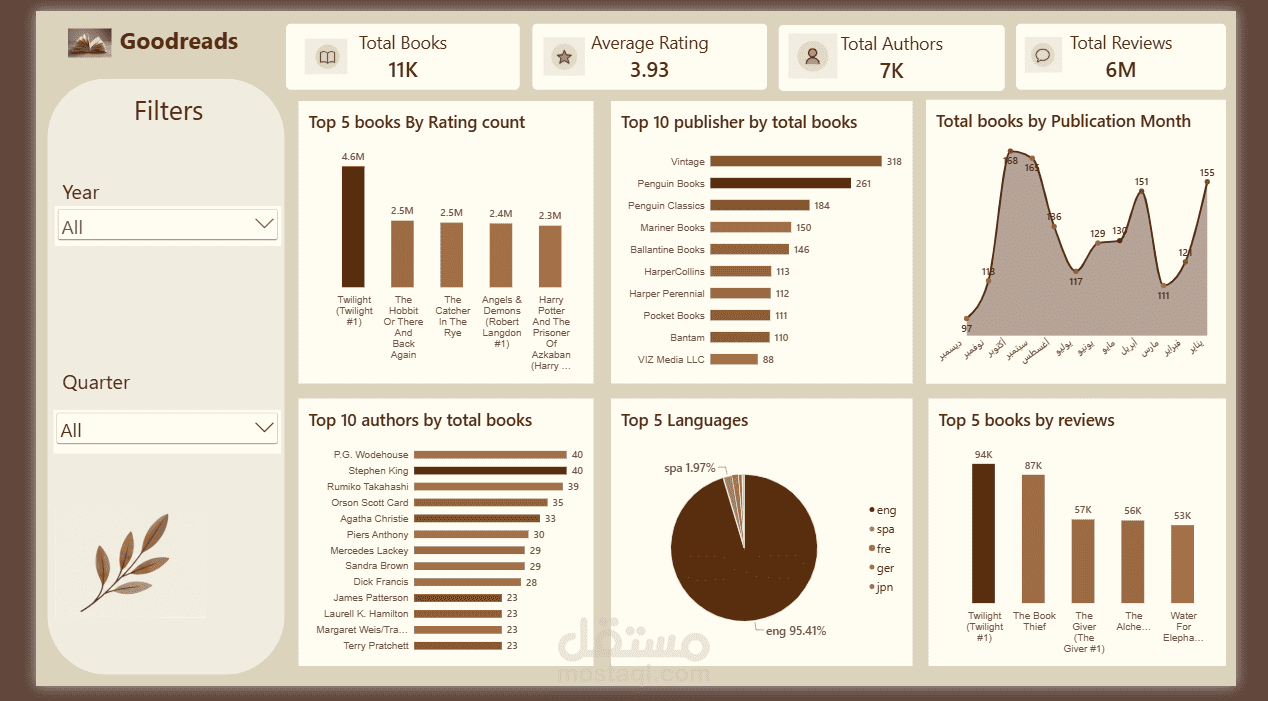

An interactive Power BI dashboard designed to analyze the Goodreads books dataset and provide insights into books, authors, publishers, ratings, reviews, and languages.
The dashboard includes key KPIs such as Total Books, Average Rating, Total Authors, and Total Reviews, with interactive Year and Quarter filters.
Key Insights
Top books based on rating count and number of reviews
Top publishers by number of books
Top authors by total books published
Books distribution by publication month
Most common book languages
Overall performance through interactive KPIs
Tools Used: Power BI, Power Query, DAX, Data Modeling & Data Visualization.