Excel Dashboard
تفاصيل العمل
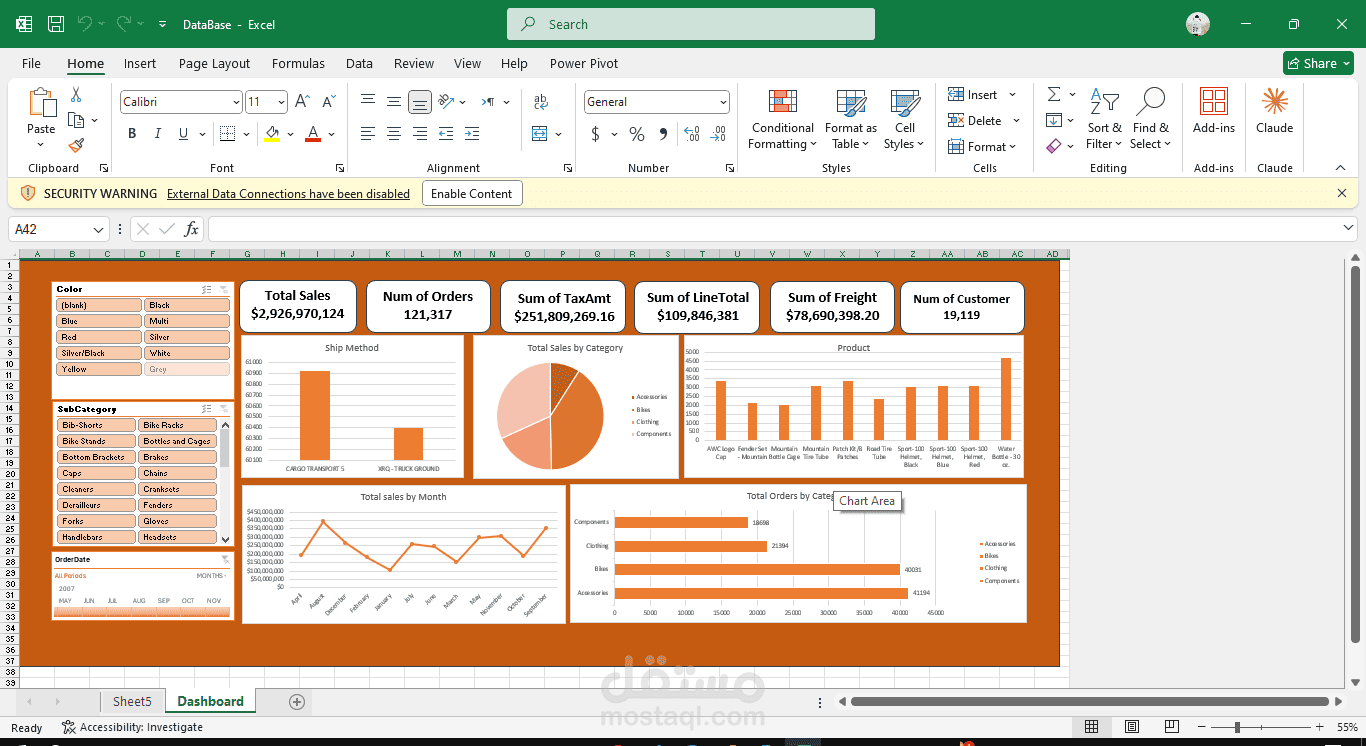
📊 Interactive Excel Executive Sales DashboardKPI Tracking: Monitored key financial metrics including Total Revenue ($2.92B), Tax Amount ($251.8M), Freight Costs ($78.7M), and Customer Volume (19,119). Category & Volume Breakdown: Constructed horizontal bar charts and pie charts highlighting category-level performance, led by Accessories (41,194 orders) and Bikes (40,031 orders). Trend & Logistics Analysis: Built time-series line charts to track monthly sales volatility and column charts to analyze cargo vs. truck freight distribution. Dynamic User Experience: Applied custom UI design with interactive Slicers (Color, SubCategory, Timeline) enabling seamless cross-filtering across all visual components.