From Sales Drop to Business Insight | North Wind Traders 📊
تفاصيل العمل
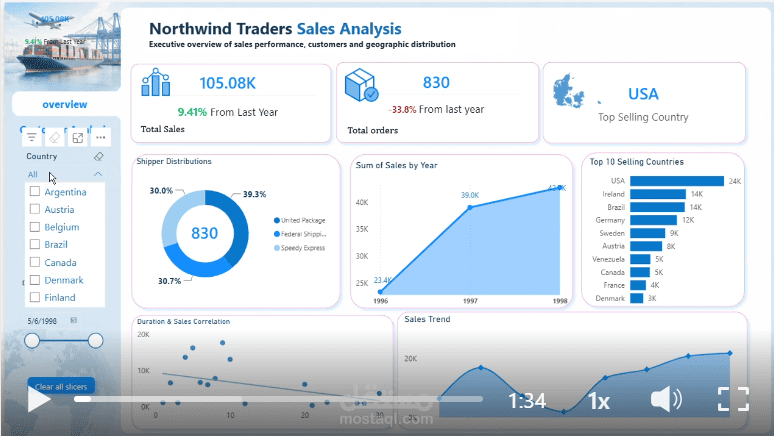
In my latest project as part of the National Telecommunication Institute (NTI), I worked on North Wind Traders with one main goal:
Understand why sales dropped and how we could improve them.
This time, I focused more on Business Understanding before jumping into the technical side.
After analyzing sales over time, I identified a significant drop and started looking for the reason behind it.
One of the strongest insights came from analyzing the relationship between Sales and Delivery Duration.
Using a Scatter Plot, I found an inverse relationship — as delivery duration increased, sales tended to decrease. 📉
So I went deeper into the shipping data and discovered that one particular shipper had significantly longer delivery durations, which was strongly associated with the sales decline.
💡 Recommendation:
Improve the performance of the underperforming shipper and reduce delivery duration, keeping the actual delivery date as close as possible to the required date.
Technically, I also worked with Advanced DAX, including YOY analysis and KPI measures comparing current-year and previous-year sales.
But the biggest lesson for me was:
Data analysis isn’t just about creating dashboards.
It’s about understanding the business problem, finding the insight, and turning it into an actionable decision.