Naguib Selim Sales Dashboard
تفاصيل العمل
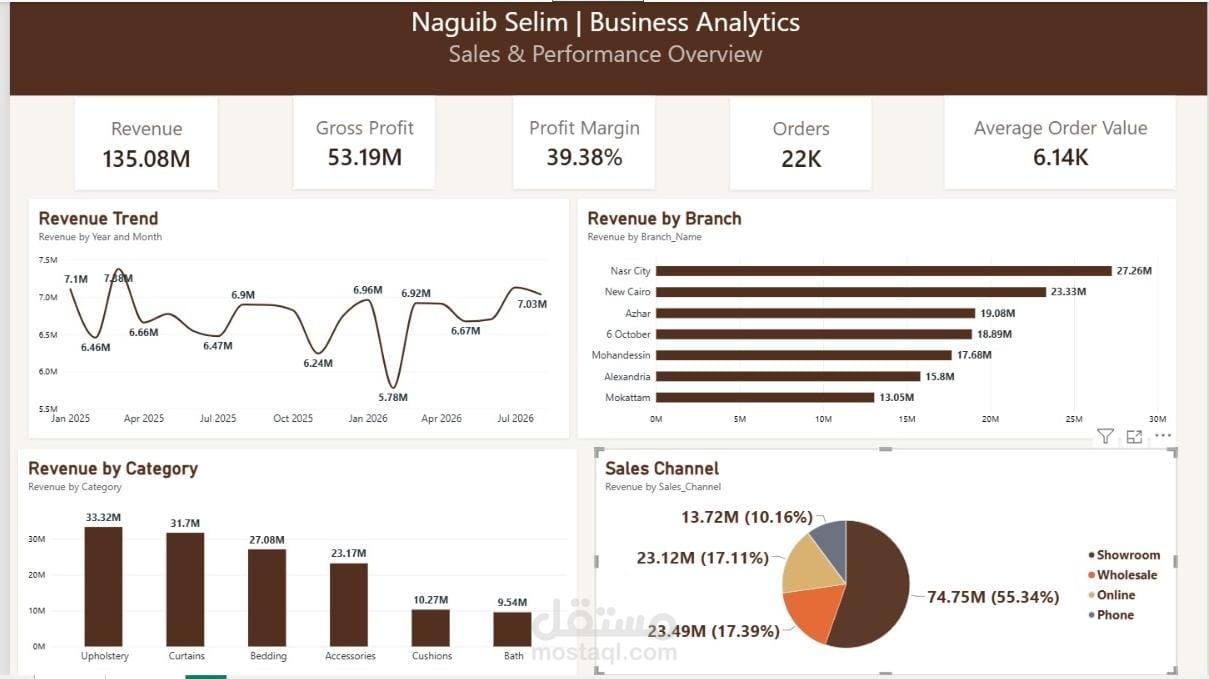
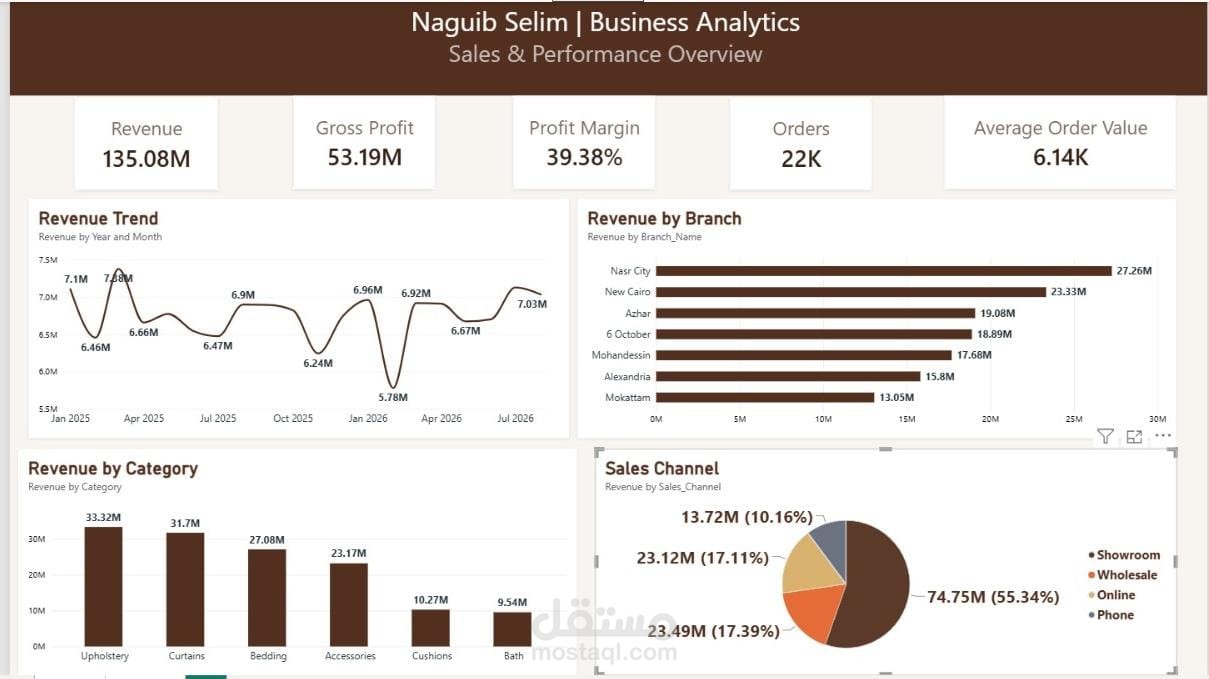
### Naguib Selim – Sales Data Analysis & Power BI Dashboard
Developed an interactive **Power BI Sales Analytics Dashboard** designed to transform raw business data into clear and actionable insights.
The project analyzes **sales orders, sales lines, revenue, gross profit, profit margin, and order performance**, providing a comprehensive view of the business's sales and profitability.
**Key Features:**
- Cleaned and analyzed raw sales data.
- Built a structured data model connecting sales orders and sales details.
- Created key business KPIs including **Revenue, Gross Profit, Profit Margin, Total Orders, and Average Order Value**.
- Designed interactive visualizations to identify sales trends and business performance.
- Used **DAX measures** to calculate and analyze key performance indicators.
- Built an interactive dashboard that allows users to explore the data and understand performance through visual interactions.
- Focused on presenting complex data in a simple, professional, and decision-ready format.
**Tools & Technologies:**
Power BI • DAX • SQL • Data Analysis • Data Visualization • Business Intelligence