Interactive T-Shirt Sales Analysis Dashboard
تفاصيل العمل
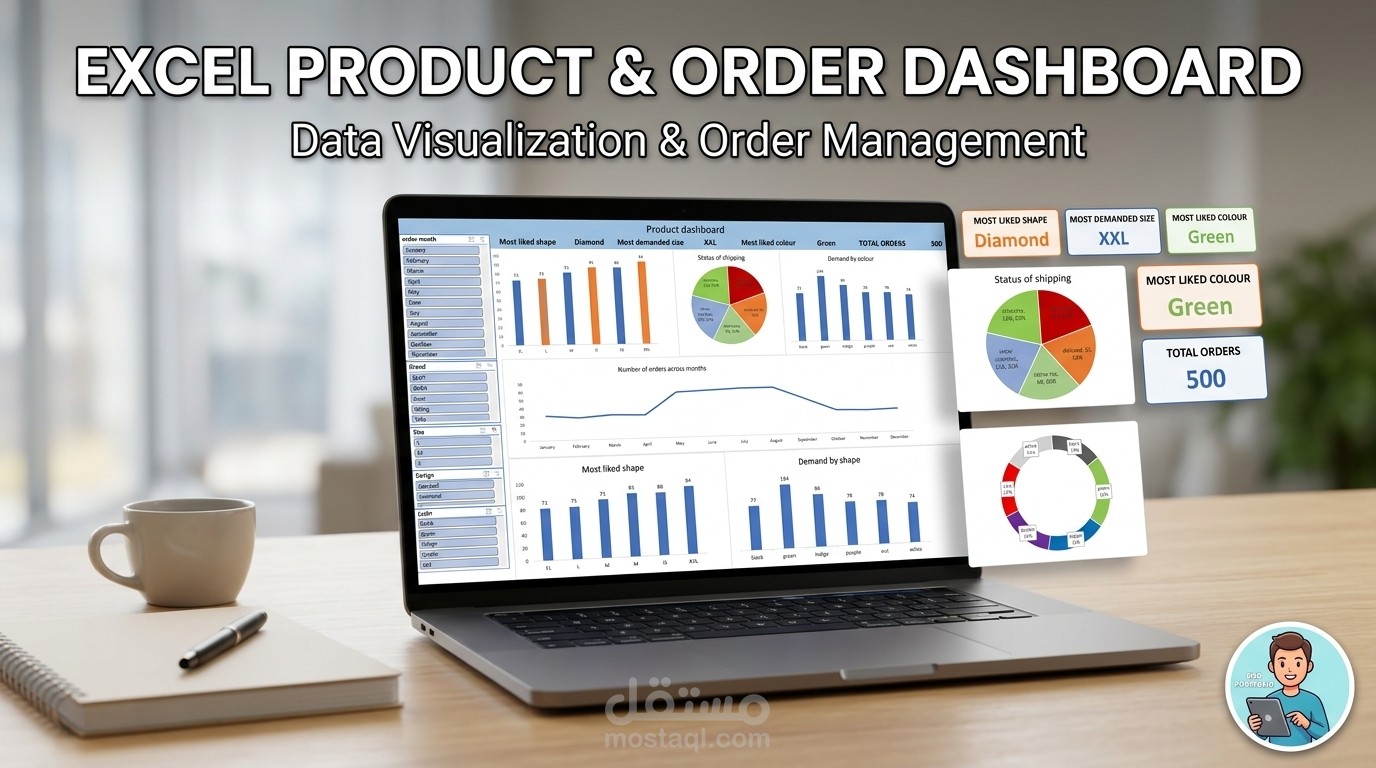
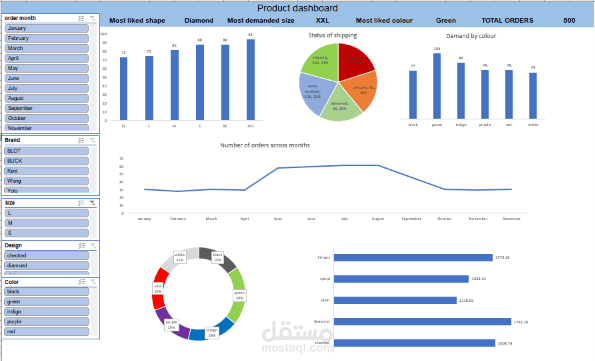
Interactive T-Shirt Sales Analysis Dashboard built in Microsoft Excel.
This project analyzes 500 T-shirt orders and transforms raw order data into a clear and interactive dashboard.
The analysis includes:
Monthly order trends
Demand by size
Customer preferences by color and design
Delivery status analysis
Price analysis by design and color
Interactive charts and visual summaries
The project demonstrates how Excel can be used to organize data, identify patterns, and present business insights in a simple and professional dashboard