Swvl Data Analysis
تفاصيل العمل
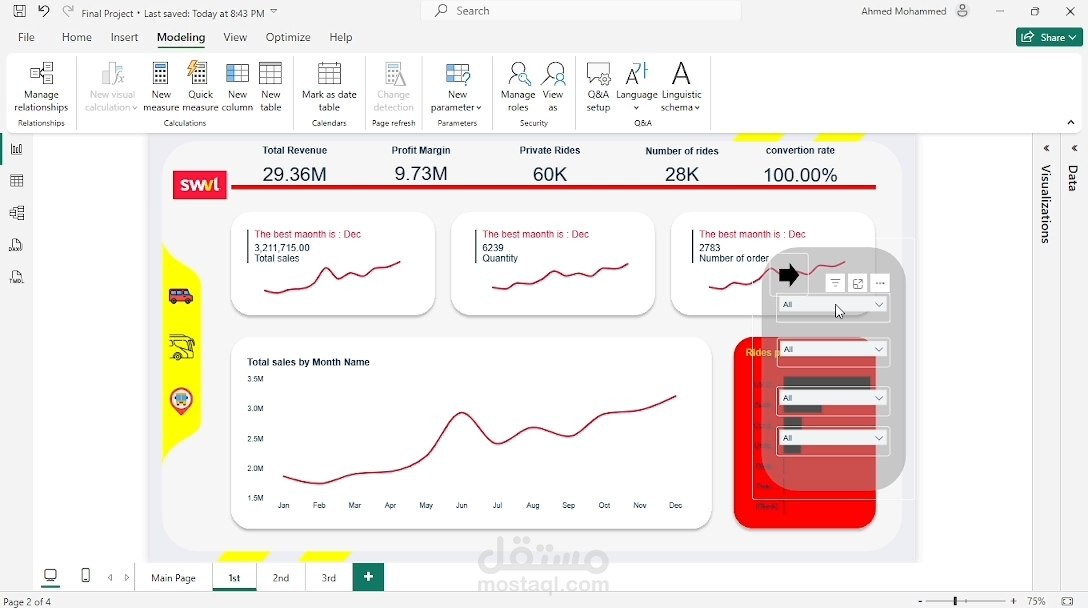
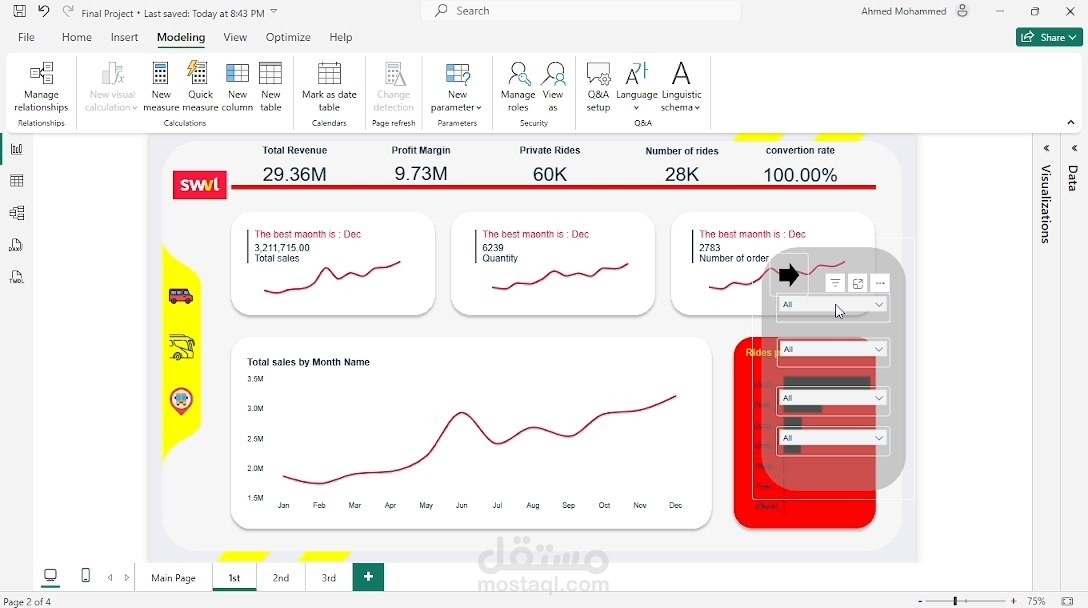
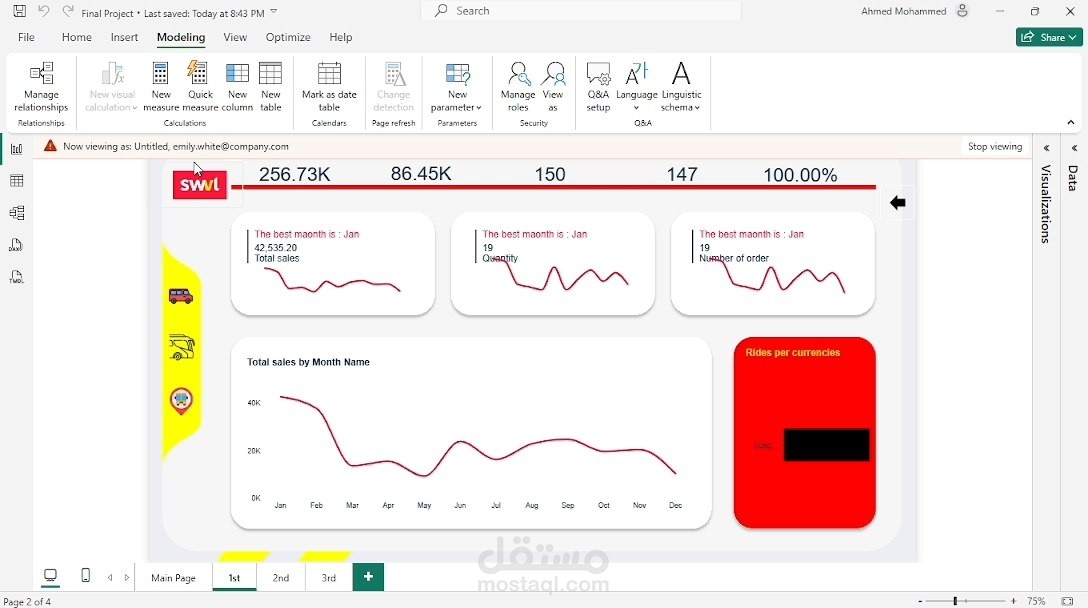
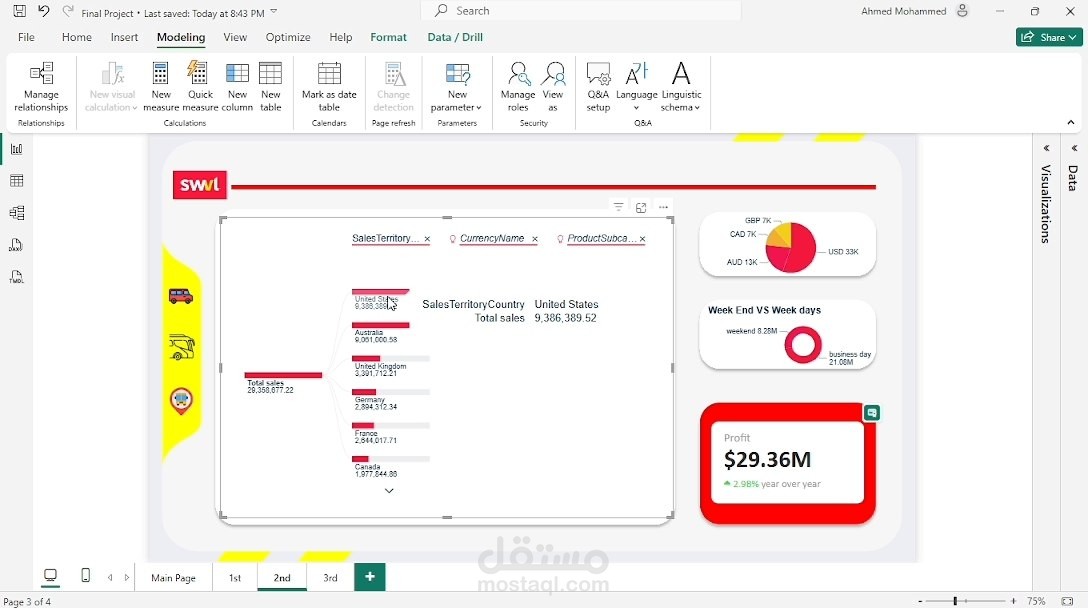
analyzing SWVL’s operational and financial performance through an interactive and dynamic dashboard.
The goal of this project was to integrate sales insights, customer behavior, and regional performance into one cohesive and professional report.
The dashboard includes:
📌 Data model built with a clean star schema
📊 Manually created DAX measures for accurate KPIs
🔐 Row-Level Security (RLS) to control user access
📑 Interactive pages for Revenue, Sales Territories, Orders, and Currency Analysis
Key insights presented:
📈 Total revenue, profit margin & YoY growth
🏆 Best-performing months
🌍 Orders by region & currency
💰 Taxes by territory
📅 Weekend vs Business day performance
🔎 Drill-down visualizations for deeper understanding
This project is a major step forward in enhancing my data analysis and BI skills — from building a structured data model, to writing advanced DAX, and designing a visually compelling dashboard.