Ford GoBike Data Analysis & Interactive Dashboard
تفاصيل العمل
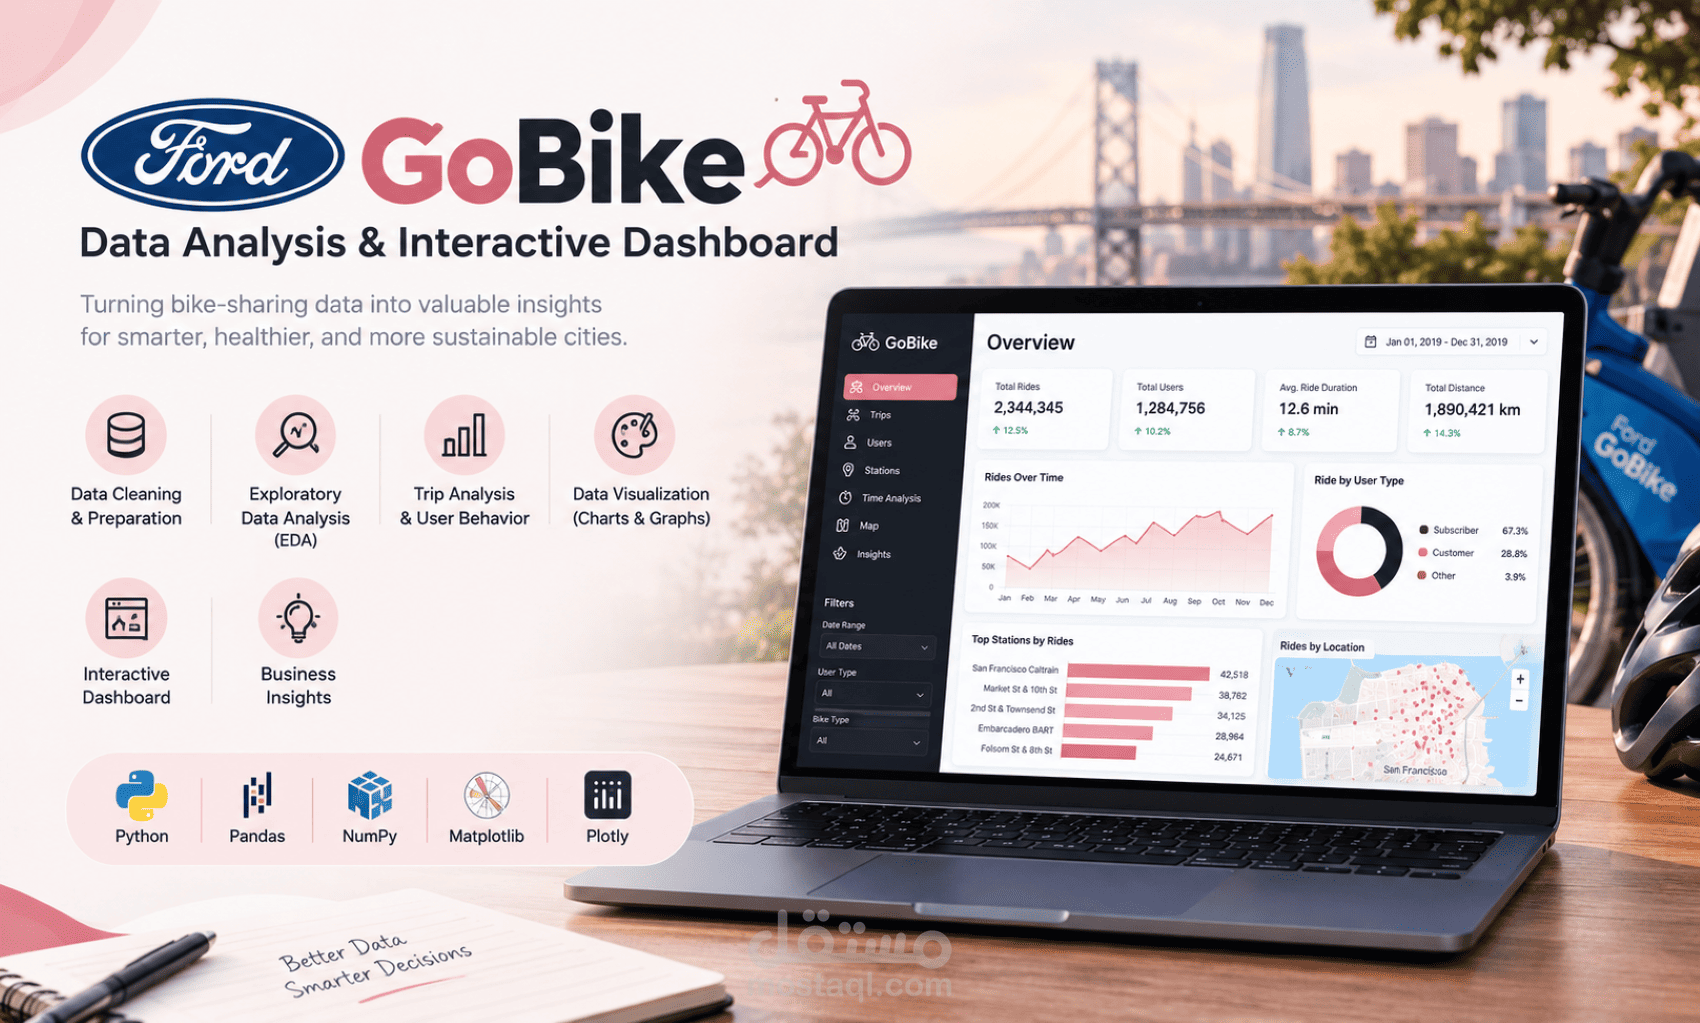
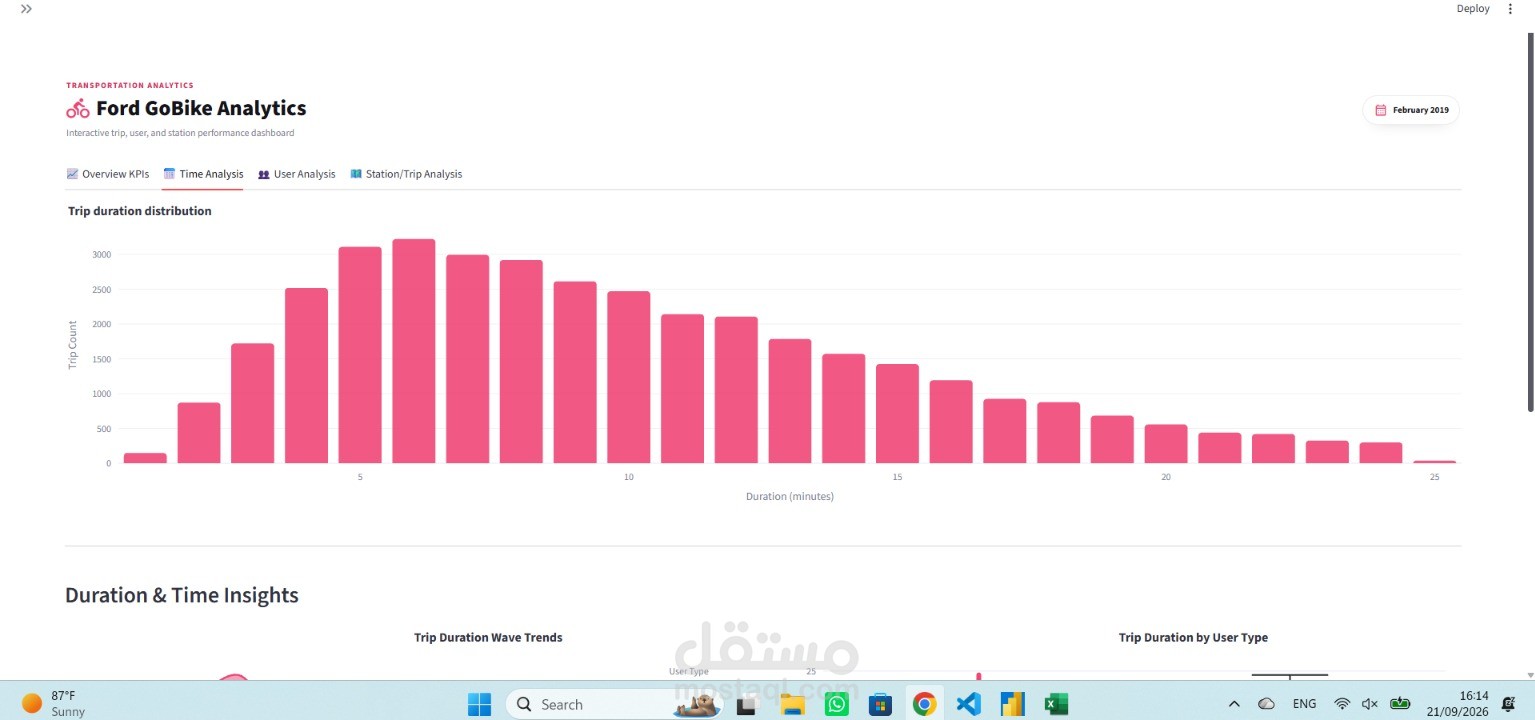
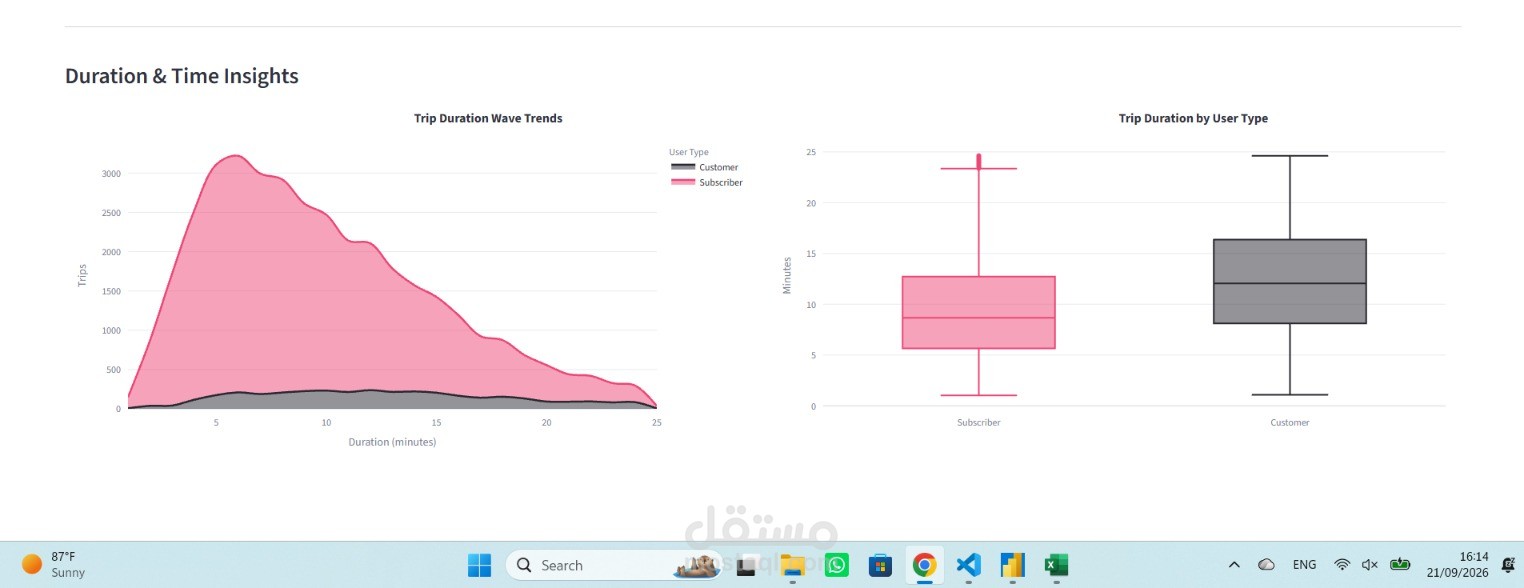
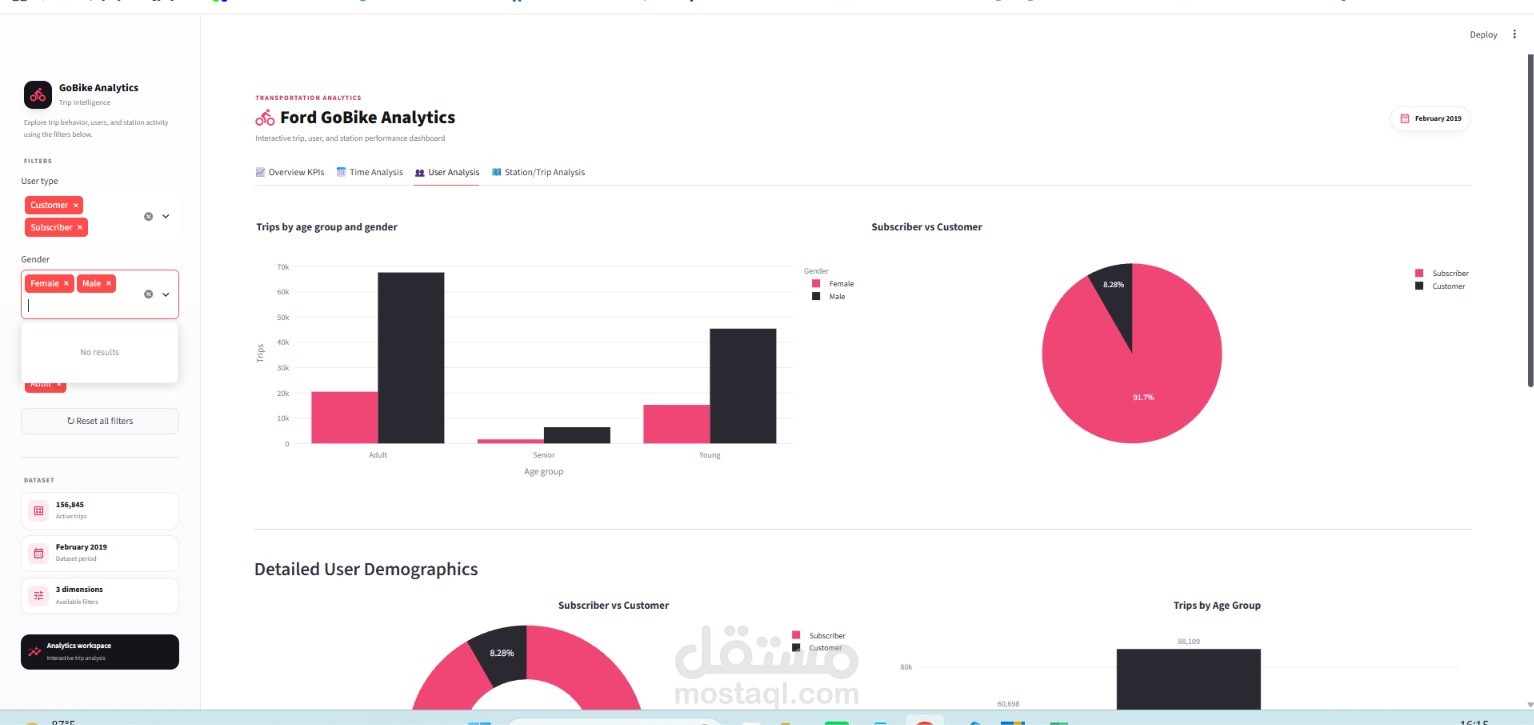
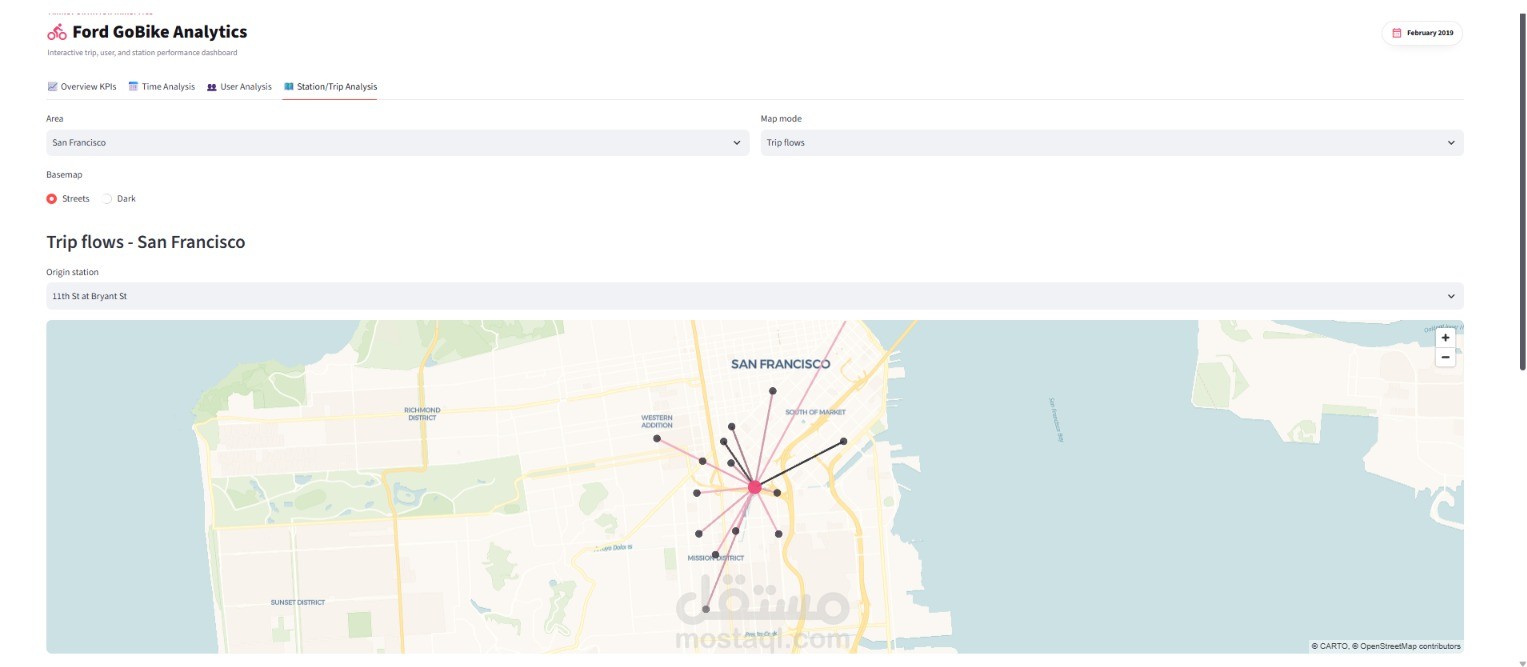
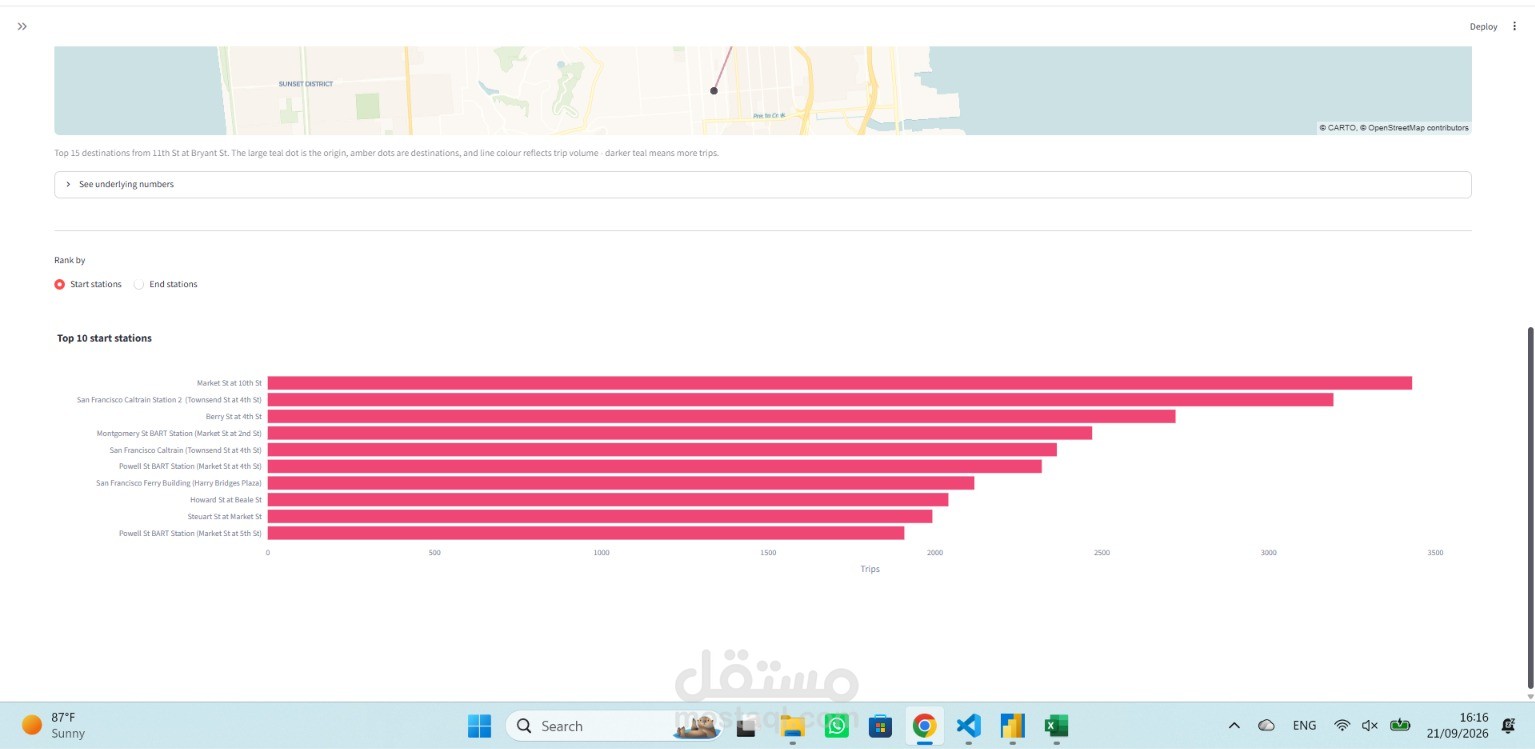
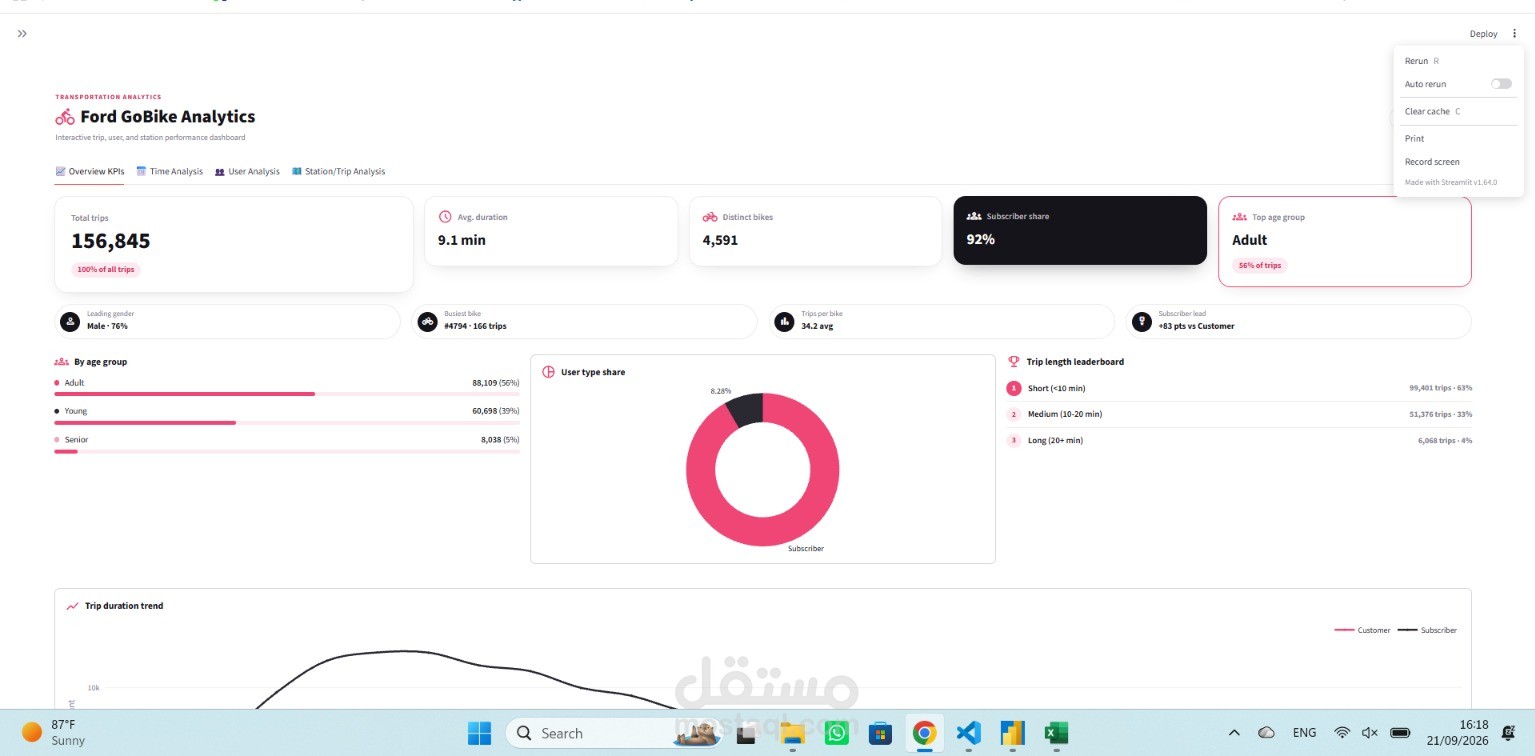
Ford GoBike Data Analysis & Interactive Dashboard
A data analysis project focused on exploring bike-sharing data, identifying usage patterns, and presenting key insights through an interactive dashboard.
The project involved preparing and analyzing the dataset, identifying important trends and patterns, and transforming the results into clear visualizations to support data-driven understanding.
Key Features:
Data cleaning and preparation.
Exploratory Data Analysis (EDA).
Analysis of trip and user patterns.
Identification of key trends and performance indicators.
Interactive data visualizations.
Dashboard design for presenting insights clearly.
Business-oriented interpretation of the analyzed data.
Technologies Used:
Python, Pandas, NumPy, Matplotlib, Plotly, Data Analysis, Data Visualization.
My Role:
Performed the data cleaning and analysis, explored the dataset to identify meaningful patterns, created visualizations, and developed an interactive dashboard to present the main findings in an accessible and professional format.
The project demonstrates the use of Python-based data analysis techniques to transform raw data into meaningful insights and interactive visual reports.