Train Delays & Performance Analysis | Tableau
تفاصيل العمل

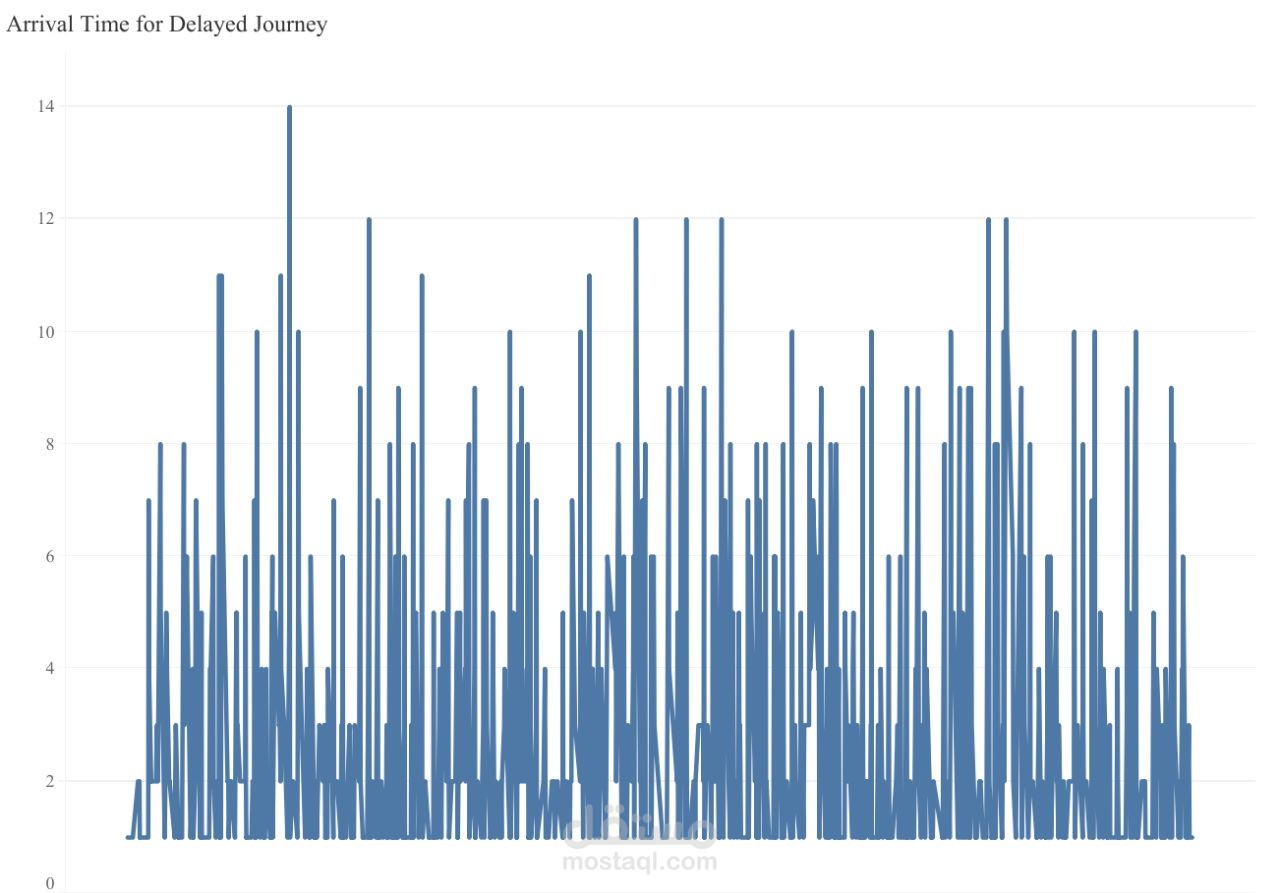
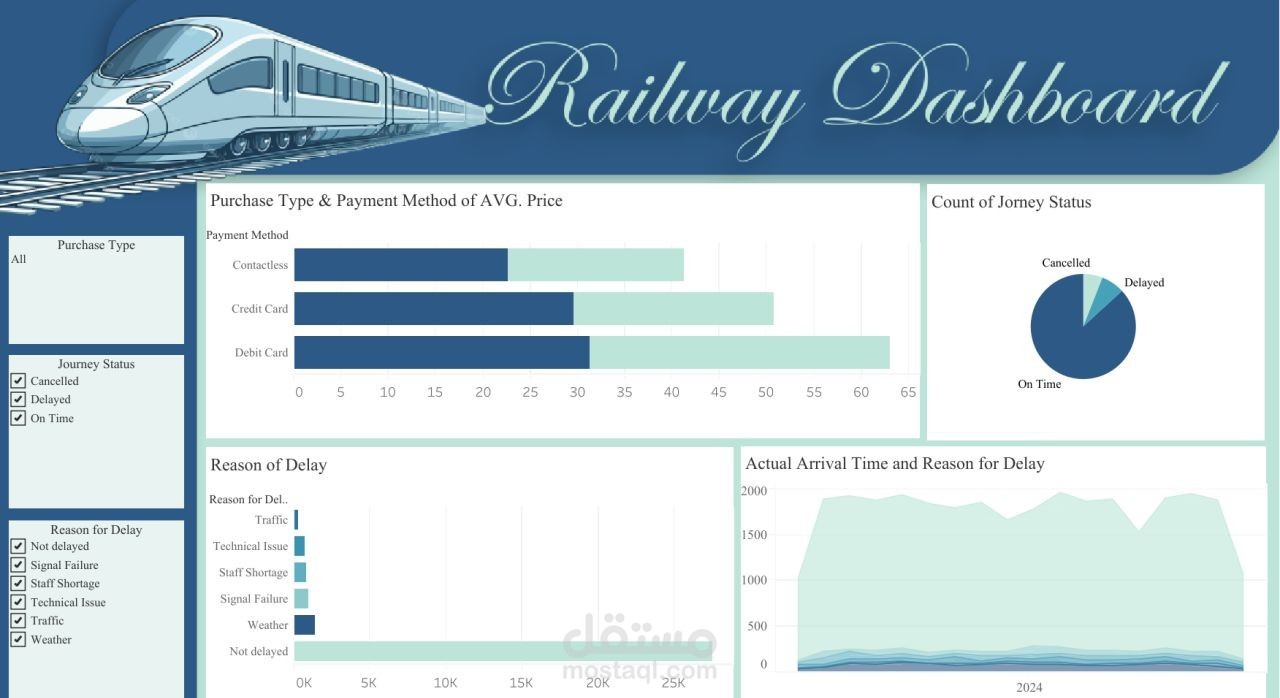
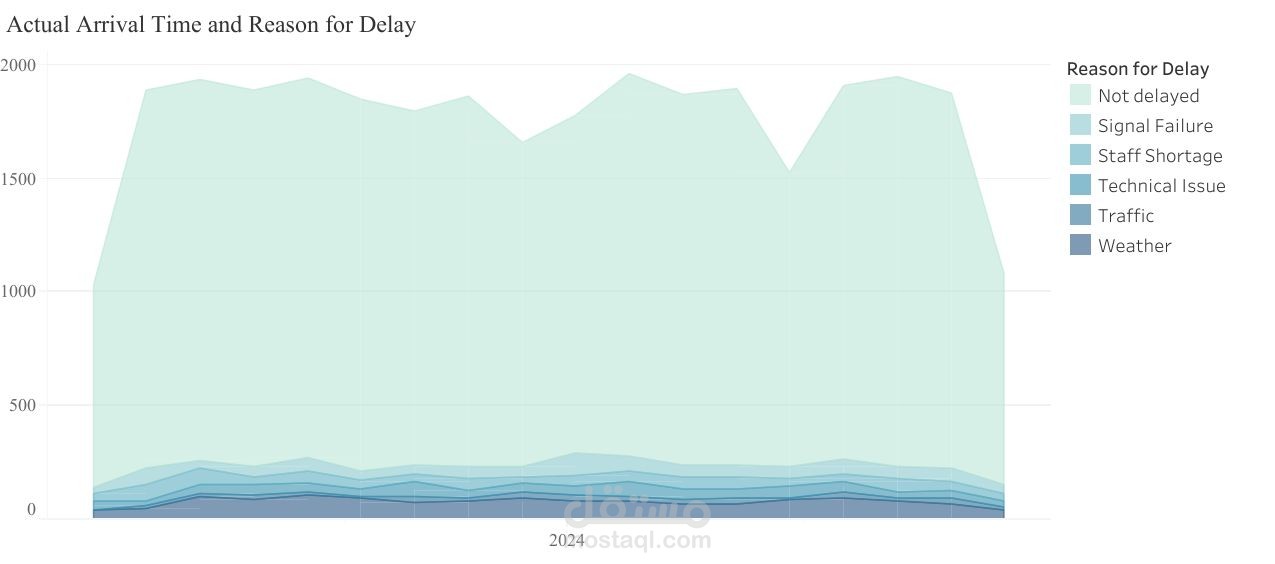
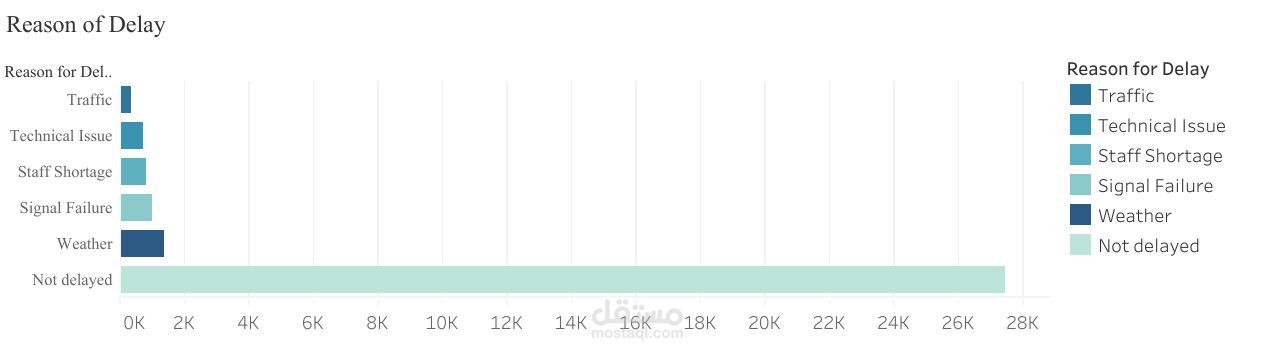
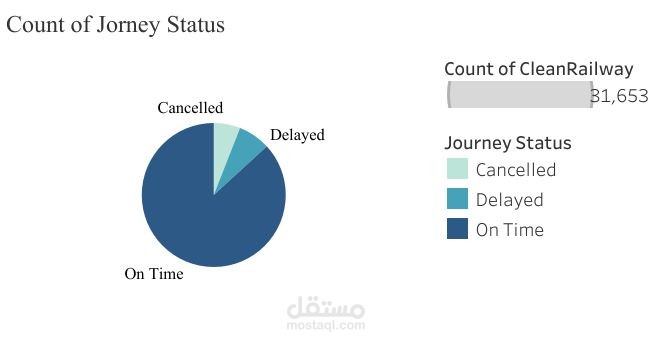
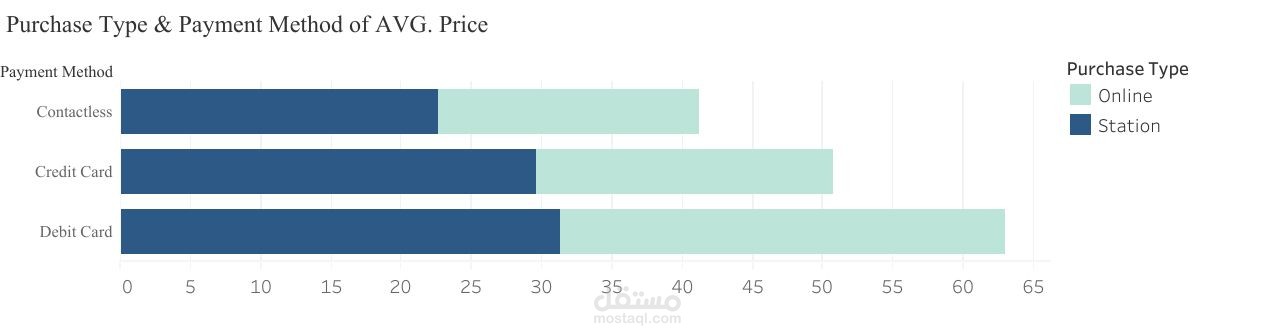
Developed an interactive Train Delay Analysis Dashboard using Tableau to analyze railway journey performance and identify the main factors contributing to train delays.
The project aimed to understand how frequently delays occurred, how they changed over time, and the key reasons behind delayed journeys.
The dataset was cleaned and prepared using Microsoft Excel, including data organization, data quality checks, and preparation for visualization.
The cleaned data was then analyzed and visualized using Tableau, where I developed an interactive dashboard to explore train delays from different perspectives.
The analysis focuses on:
• Analyzing the number of delayed journeys over the selected period
• Identifying the main causes of train delays
• Exploring delay patterns and trends over time
• Comparing train performance across different categories
• Creating interactive visualizations to make the insights easier to explore and understand
Tools: Microsoft Excel | Tableau
This project strengthened my skills in Data Cleaning, Data Visualization, Exploratory Data Analysis, Dashboard Design, and Business Insight Generation.