Headline KPIs and the big-picture view
تفاصيل العمل
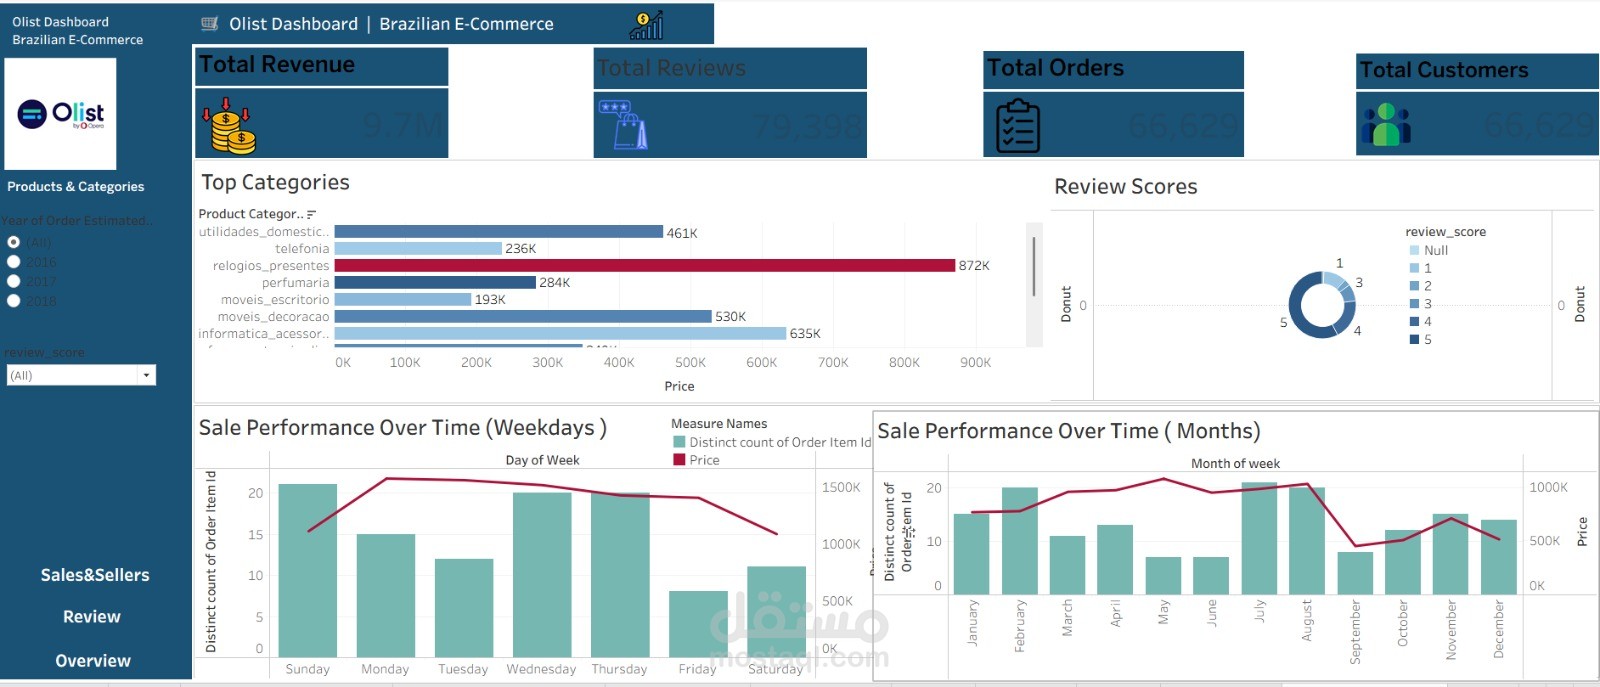
An interactive Tableau dashboard built on the Olist Brazilian E-Commerce dataset. It turns thousands of raw order, product, and review records into a clear, multi-page report. Business owners can see what sells, when it sells, and how satisfied customers are, then act on it.
Key metrics
Total Revenue: 9.7M
Total Orders: 66,629
Total Customers: 66,629
Total Reviews: 79,398
What the dashboard covers
Top product categories: Ranked by revenue, with watches and gifts leading at 872K.
Sales trends: Orders and revenue by weekday and by month, revealing peak periods such as July and August.
Customer satisfaction: A review score breakdown (1 to 5 stars), showing that most customers give 5 stars.
Most rated products: Categories compared by review score across 2016, 2017, and 2018.
Geographic analysis: A map of Brazil showing average review score by state (3.56 to 4.33), highlighting the strongest and weakest regions.
Seller performance: A dedicated Sales & Sellers page.
Interactivity
Year and review score filters that update every chart.
Navigation buttons linking the Overview, Products & Categories, Sales & Sellers, and Review pages.
Business value
Identifies the categories and products that drive the most revenue and the best ratings.
Shows the best days and months for campaigns and inventory planning.
Pinpoints the states where customer satisfaction is high and where service needs improvement.
Tools: Tableau, SQL, Excel, Python
Skills demonstrated: Data cleaning and modeling, KPI design, geographic analysis, interactive dashboard design, and data storytelling.