Olist Brazilian E-Commerce Interactive Dashboard
تفاصيل العمل
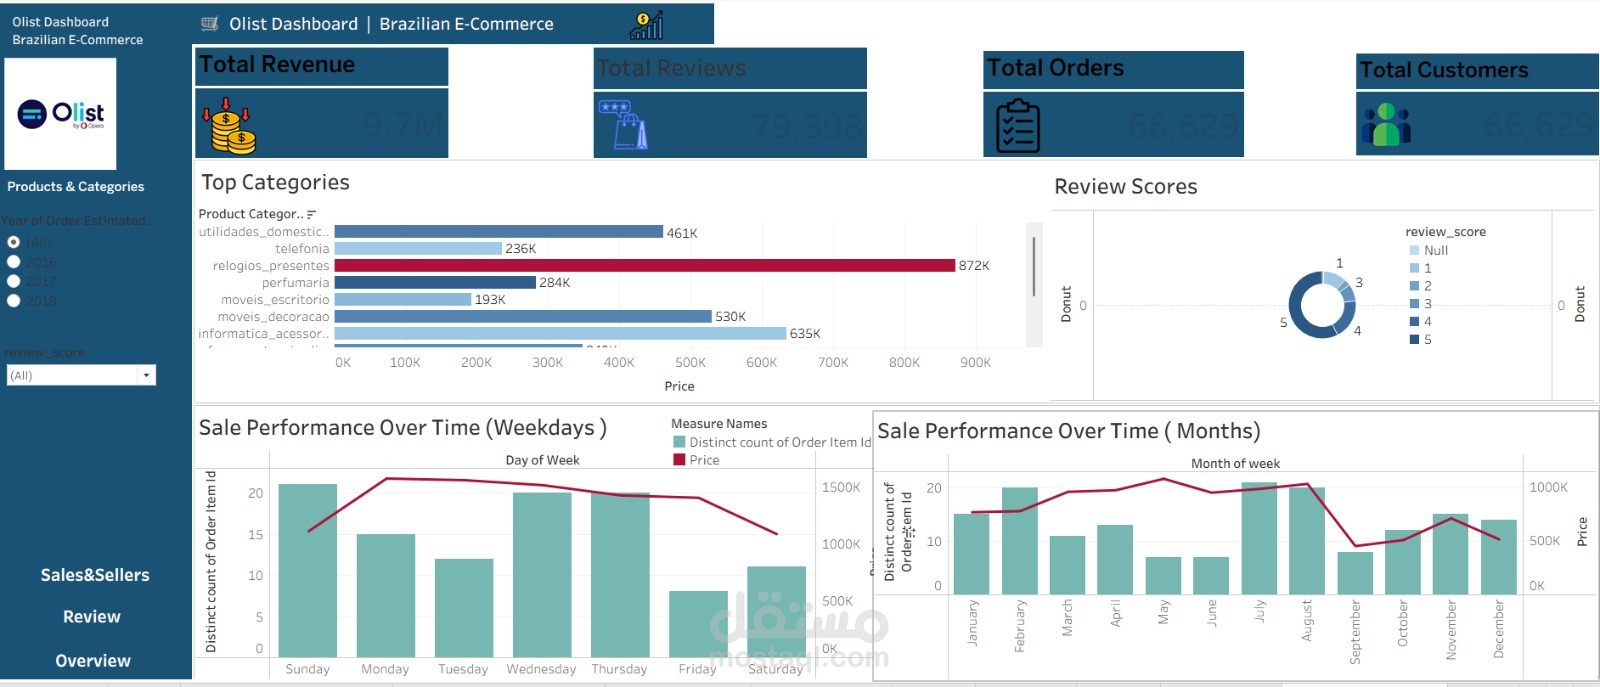
Olist Brazilian E-Commerce Interactive Dashboard
Overview
An interactive sales and customer analytics dashboard built on the Olist Brazilian E-Commerce dataset. It turns thousands of raw order, product, and review records into one clear view, so business owners and managers can see how the store is performing and make decisions quickly.
What the dashboard includes
KPI cards: Total Revenue (~9.7M), Total Orders (66,629), Total Customers (66,629), and Total Reviews (79,398).
Top Categories: A ranked bar chart of product categories by revenue. It shows that the watches and gifts category leads with 872K, followed by computer accessories, home decor, and housewares.
Review Scores: A donut chart of customer satisfaction, split by rating from 1 to 5.
Sales Performance by Weekday: Order counts and revenue for each day of the week, showing which days sell best.
Sales Performance by Month: Monthly order volume and revenue, showing seasonality and peak months such as July and August.
Interactive filters: Filter by year (2016, 2017, 2018) and by review score, so every chart updates dynamically.
Multi-page navigation: Separate pages for Overview, Sales & Sellers, and Review.
Key insights it delivers
Which product categories drive the most revenue.
The best days and months for sales, which helps with planning campaigns and inventory.
How satisfied customers are, and how that connects to sales performance.
Tools used
Tableau / Power BI, SQL for data extraction and cleaning, and Excel / Python for data preparation.
Skills demonstrated
Data cleaning and modeling, KPI design, dashboard storytelling, interactive visualization, and business insight extraction.