Superstore 2019 – Interactive Sales Analysis Dashboard Using Power BI
تفاصيل العمل
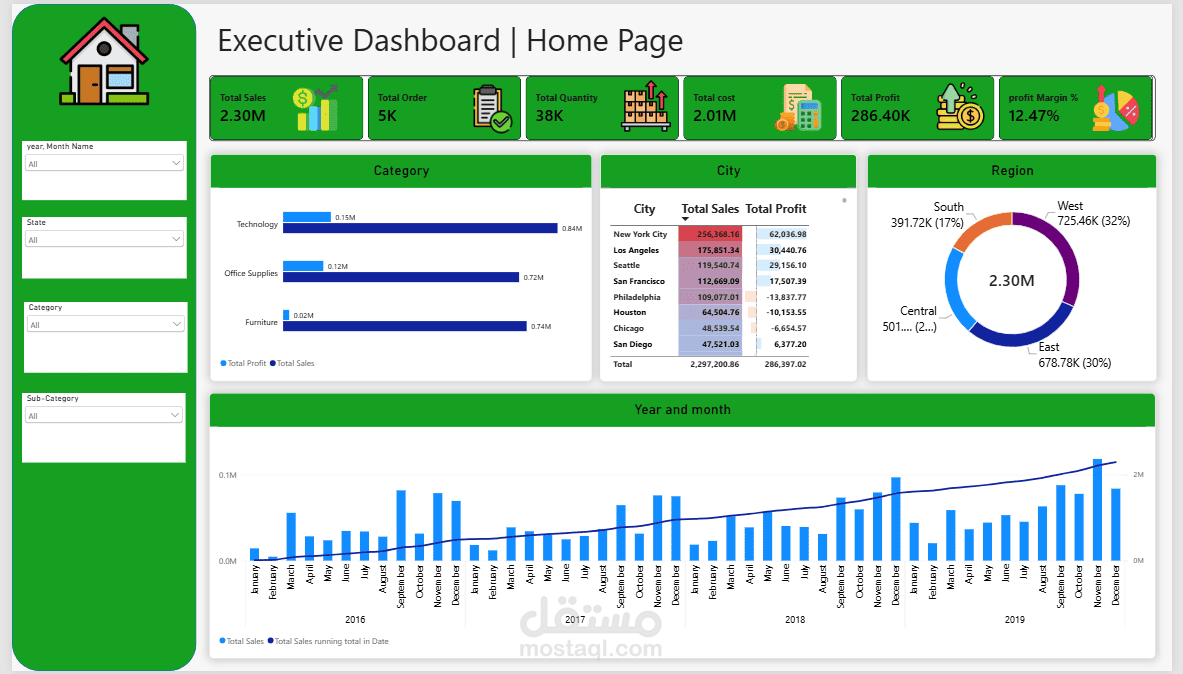
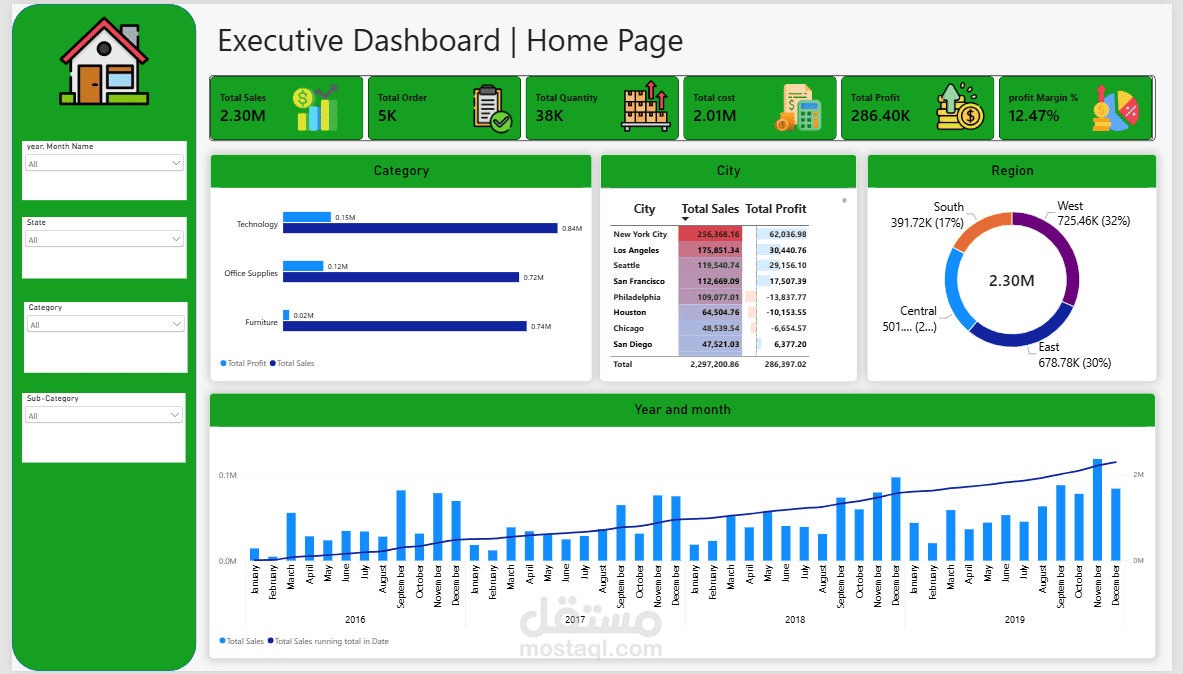
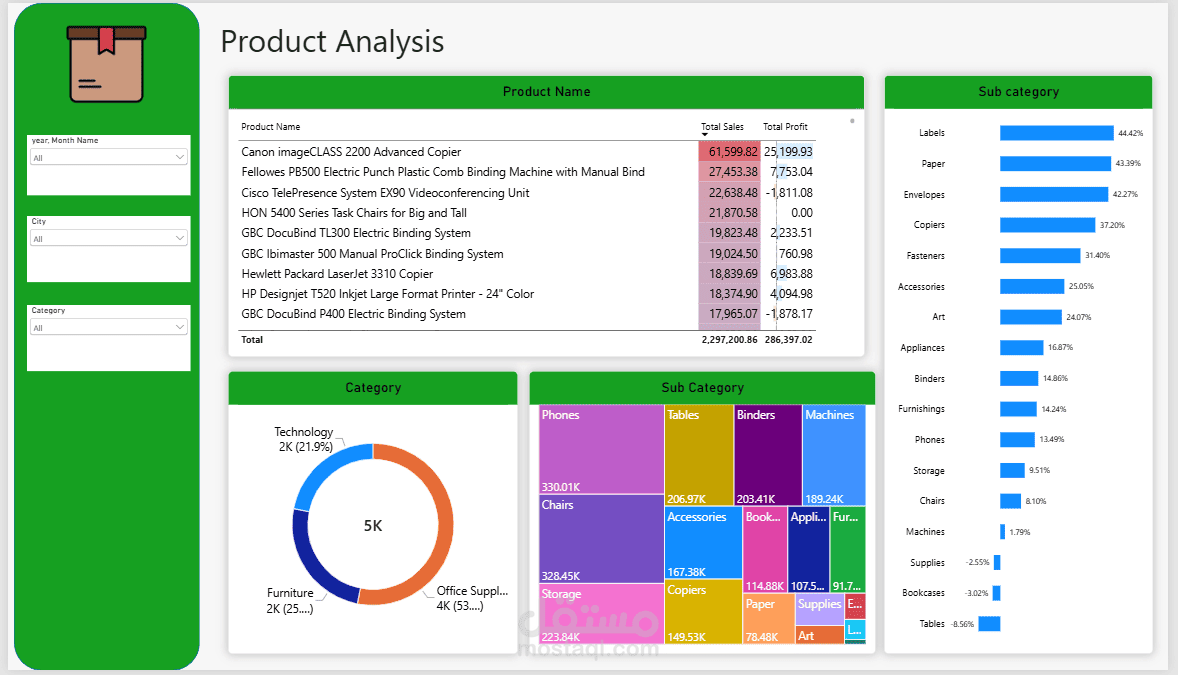
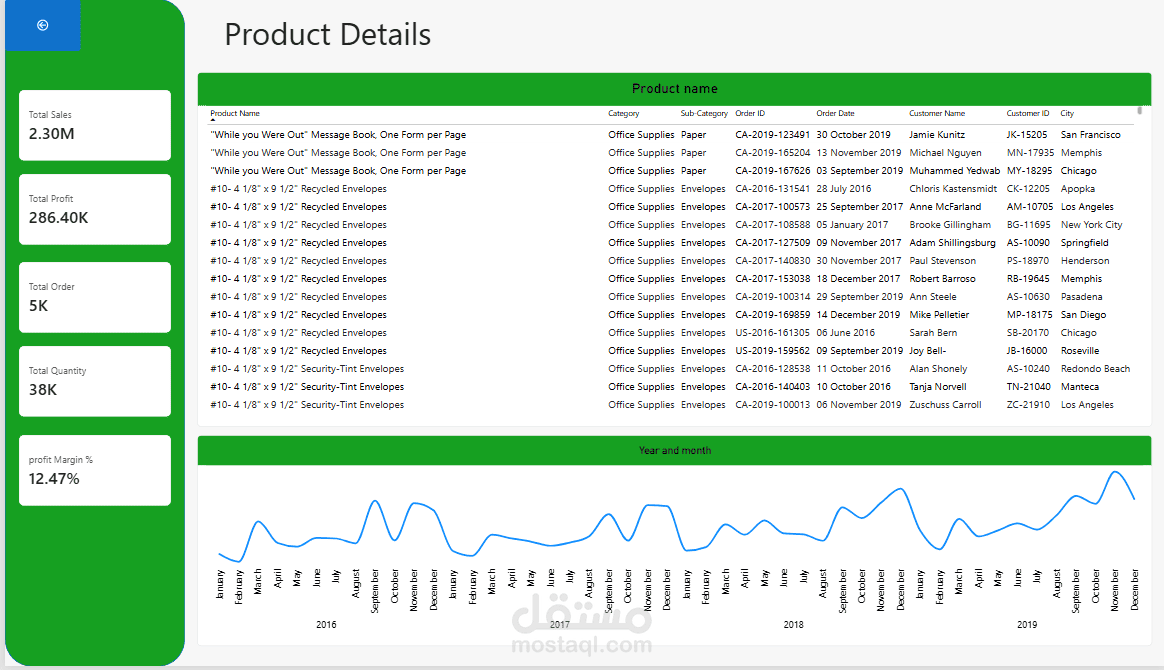
This project is an interactive sales analysis dashboard built using Power BI to analyze the Superstore 2019 dataset.
The dashboard consists of three main pages:
- Home Page: Provides an overview of business performance using KPI cards, including Total Sales, Total Orders, Total Quantity, Total Cost, and Total Profit. It also includes interactive filters for Category, City, Region, Year, and Month.
- Product Analysis: Focuses on analyzing product performance, identifying sales trends, and exploring key product-related insights.
- Product Details: Uses Power BI's Drill-through feature to provide detailed insights into individual products.
The goal of this project is to transform raw sales data into clear, interactive visualizations that make it easier to understand business performance and explore product insights.