Real Estate Dashboard
تفاصيل العمل
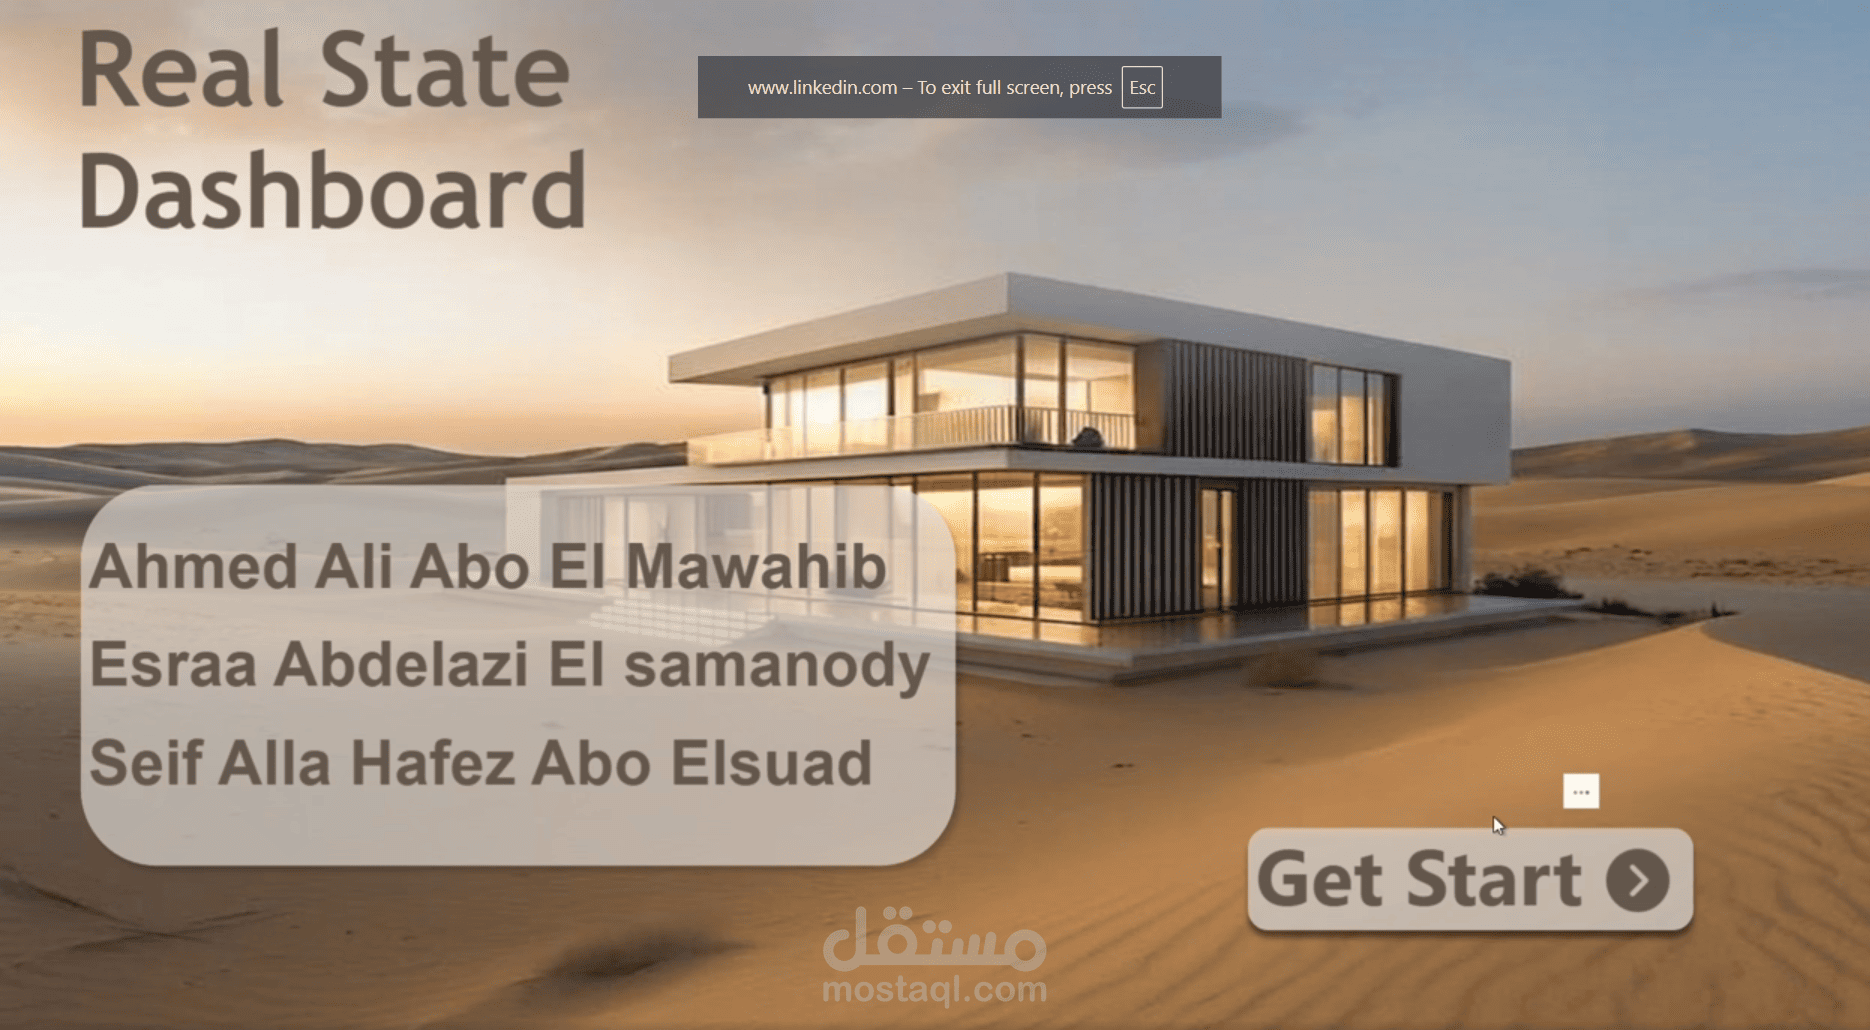
The dashboard was made by power bi and has four pages:
Home → Revenue, properties sold, expenses, and income, with revenue broken down by month, sales channel, and country
Sales → Paid vs. pending sales, price per meter and profit margin by country, and net profit by property type
Financial & Expenses → Total expenses, expense breakdown by type, and expense trends by month and country
Client → Client count, average revenue per client, and sales performance by client occupation
Every page connects through navigation links, plus a light/dark mode toggle for the whole dashboard.