bank loan summary
تفاصيل العمل
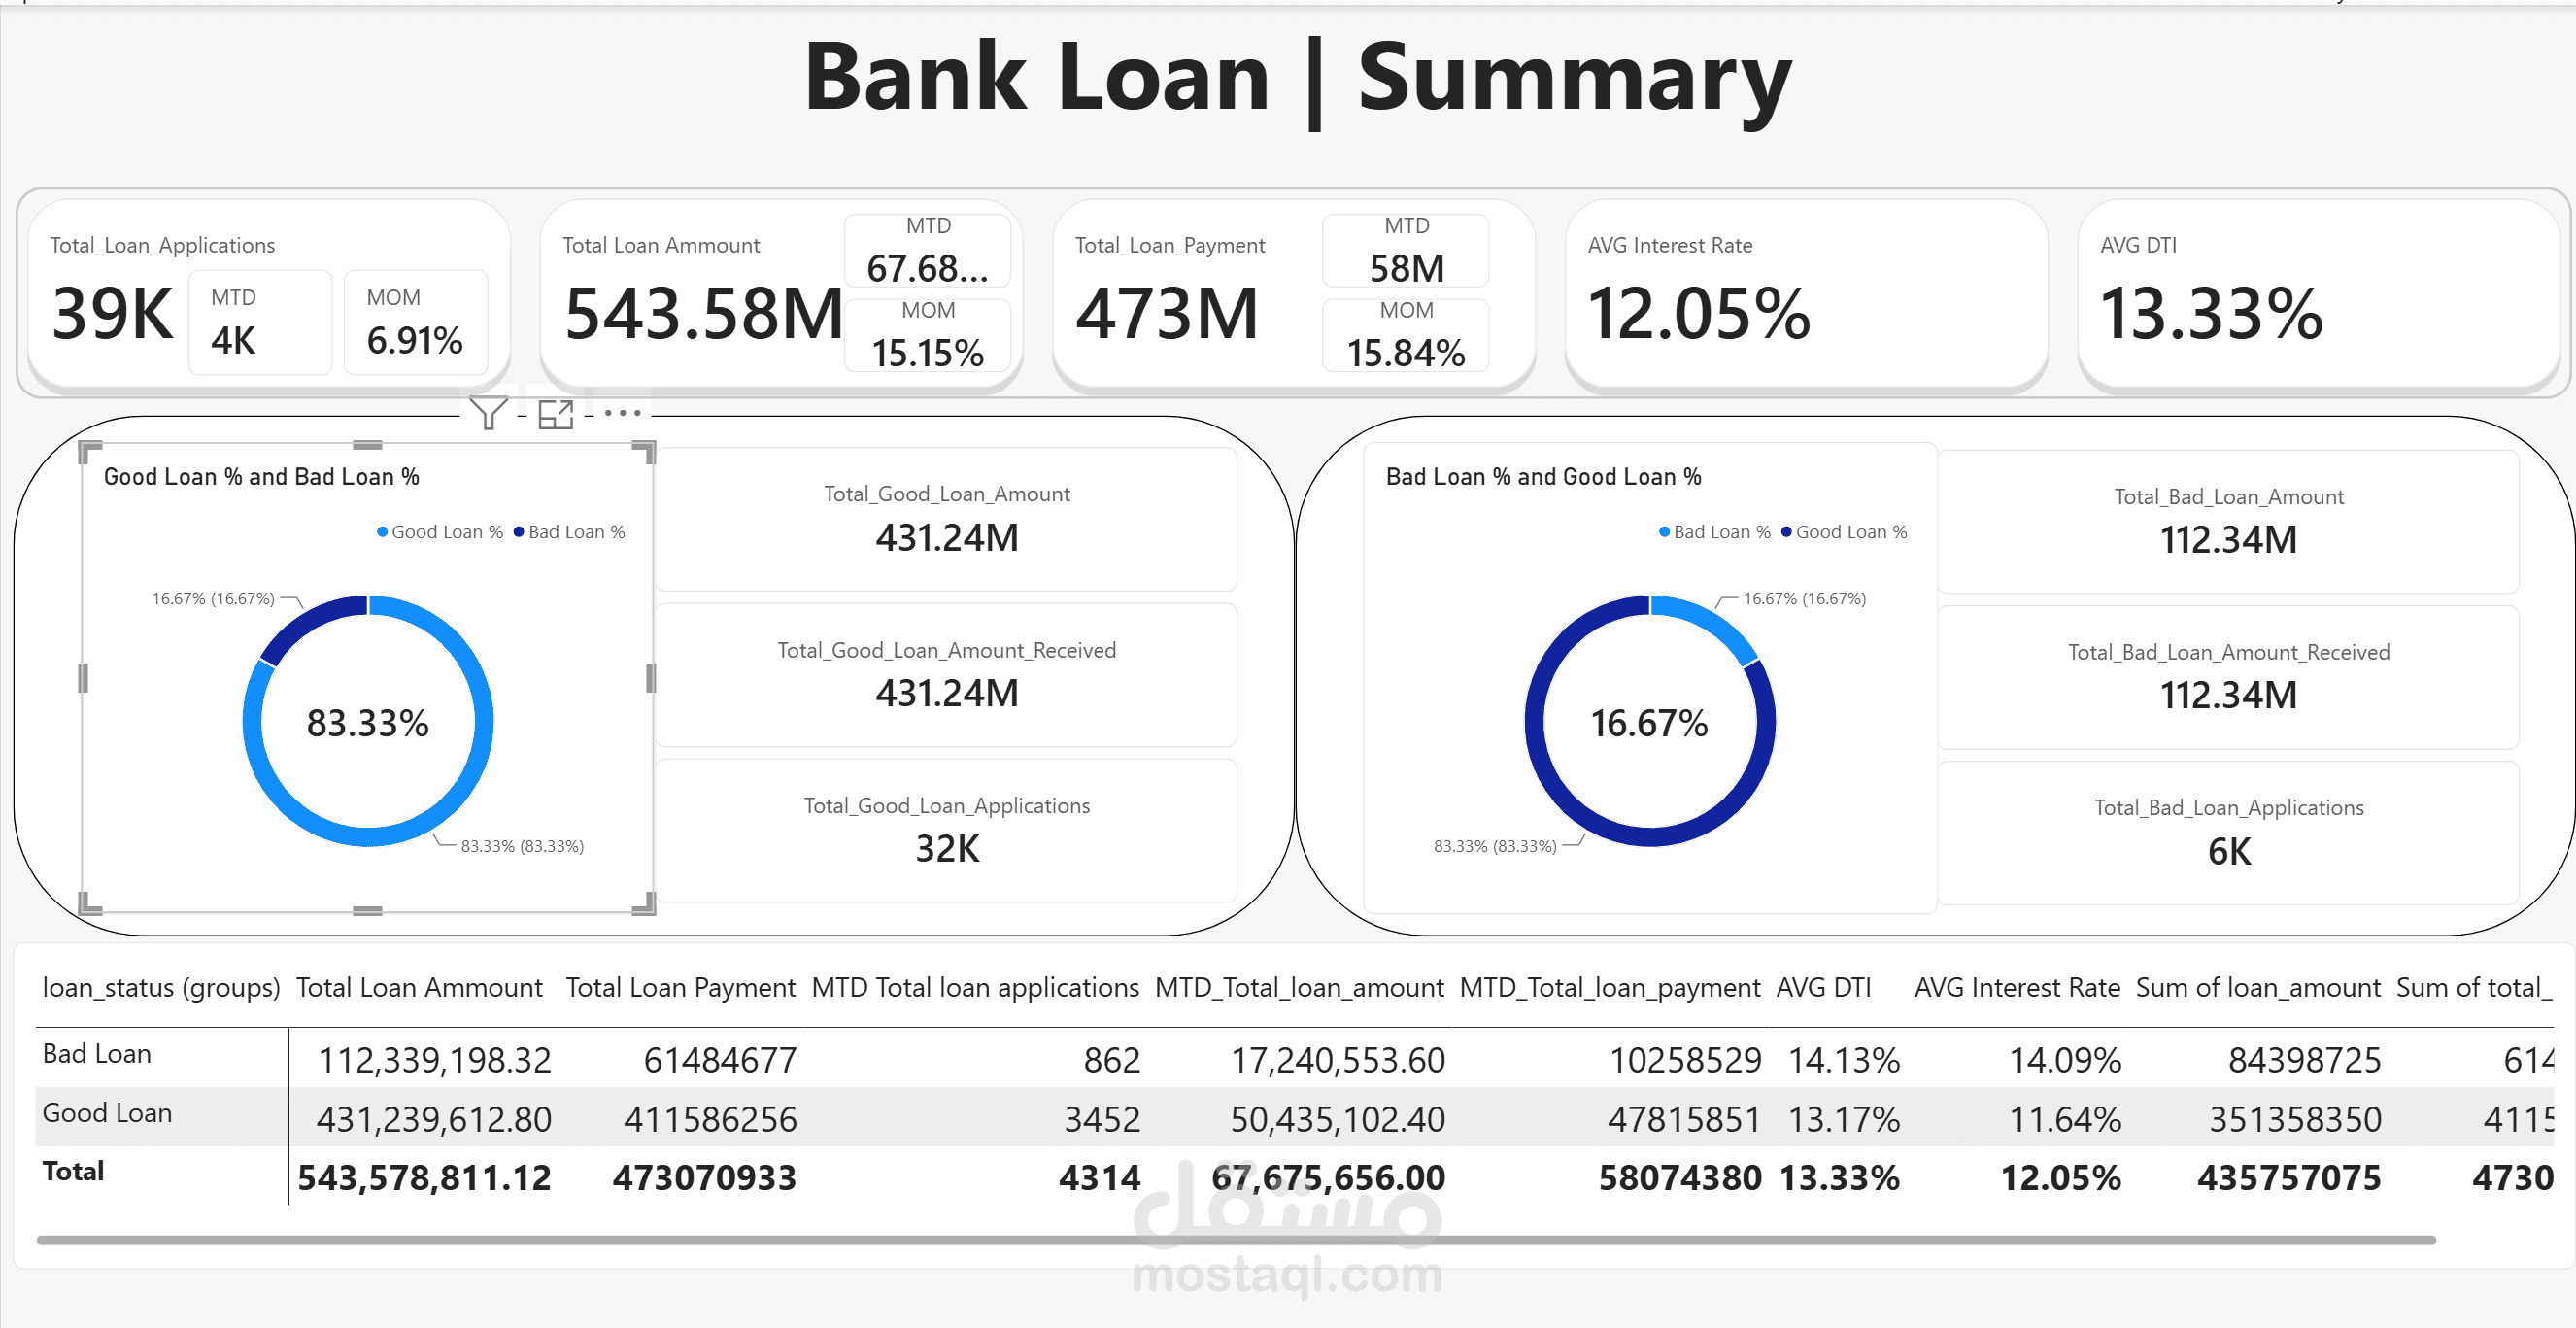
Bank Loan Summary Dashboard
This Power BI dashboard provides an interactive overview of the bank’s loan portfolio, applications, payments, and loan performance.
It highlights key KPIs including 39K loan applications, 543.58M total loan amount, 473M total payments, 12.05% average interest rate, and 13.33% average DTI.
The dashboard also analyzes:
📈 Monthly loan application trends
🌍 Applications by geographical location
🏠 Home ownership distribution
💼 Employment length
🎯 Loan purpose
📅 Loan term
⚠️ Good vs. Bad Loan performance
The second page provides a deeper analysis of loan quality, showing 83.33% Good Loans vs. 16.67% Bad Loans, along with their respective amounts, applications, payments, and financial metrics.
Overall, the dashboard turns raw loan data into clear visual insights that can help monitor lending performance, understand customer behavior, and identify loan risk patterns.