Executive Sales Performance & Financial Dashboard
تفاصيل العمل
Project Description:
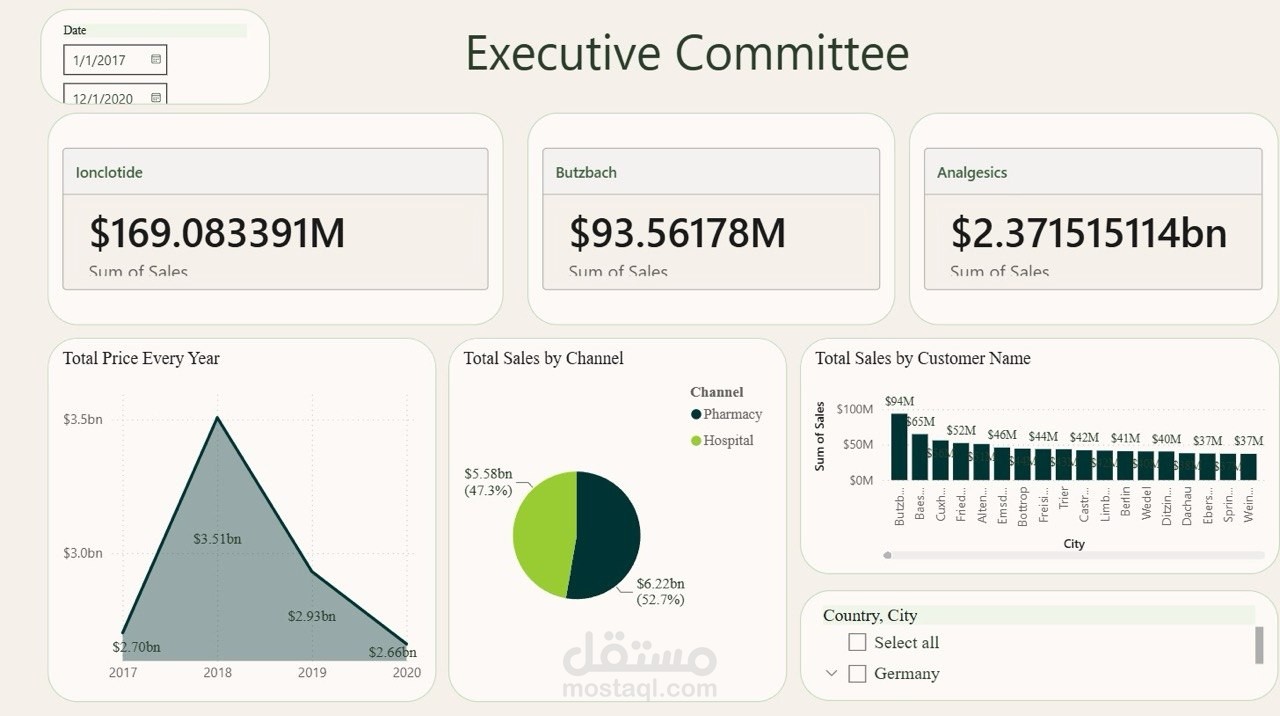
I developed a dynamic, executive-level financial and sales analytics dashboard designed to monitor revenue metrics, customer performance, and distribution channels over time.
Key Features & Analytical Steps:
Key Performance Indicators (KPIs): Created custom summary cards for quick executive overview, tracking key metrics such as sales revenue across product categories (e.g., Ionclotide: $169.08M, Analgesics: $2.37Bn) and regions (e.g., Butzbach: $93.56M).
JPG
Sales Trend Analysis: Implemented an area chart displaying annual revenue trends (Total Price Every Year) from 2017 to 2020, highlighting revenue peaks (reaching $3.51Bn in 2018).
JPG
Channel Distribution Breakdown: Visualized revenue share between sales channels (Pharmacy vs. Hospital), illustrating comparative performance ($6.22Bn / 52.7% vs. $5.58Bn / 47.3%).
JPG
Customer & Regional Performance: Designed a ranked bar chart showing top customers/cities by total sales along with multi-select regional slicers (Country, City, Date range).
JPG
UI/UX Design: Formatted with a modern, light-themed layout using clean card containers and intuitive visual hierarchy tailored for decision-makers.