القاهره
تفاصيل العمل
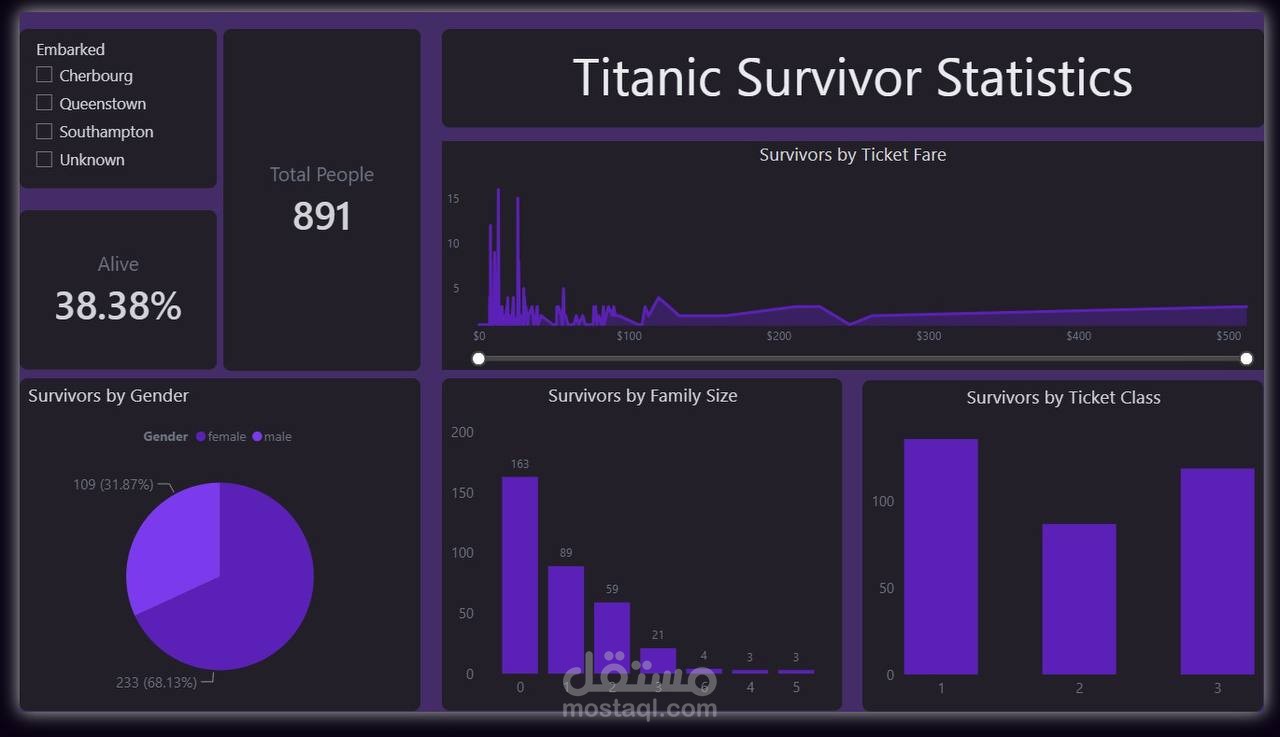
### **Project Title:**
**Titanic Survival Analysis & Interactive Dashboard**
---
### **Project Description:**
I designed and developed an interactive data analytics dashboard to analyze and explore the key factors influencing survival rates among Titanic passengers.
#### **Key Features & Analytical Steps:**
* **Data Cleaning & KPI Metrics:** Processed the dataset to handle missing values and highlighted core metrics, including **Total Passengers (891)** and overall **Survival Rate (38.38%)**.
* **Demographic & Class Analysis:** Visualized survival distribution by **Gender** and **Ticket Class** to identify primary demographic trends.
* **Family Size & Fare Insights:** Analyzed survival patterns based on **Family Size** and **Ticket Fare ranges** using interactive charts.
* **Dynamic Filtering:** Integrated multi-criteria slicers (e.g., **Port of Embarkation**) allowing users to dynamically filter and drill down into the data.
* **UI/UX & Visual Design:** Built a clean Dark-Mode dashboard interface tailored for seamless navigation and intuitive data storytelling.