Bakery Sales Performance & Forecasting Dashboard Using Power BI
تفاصيل العمل
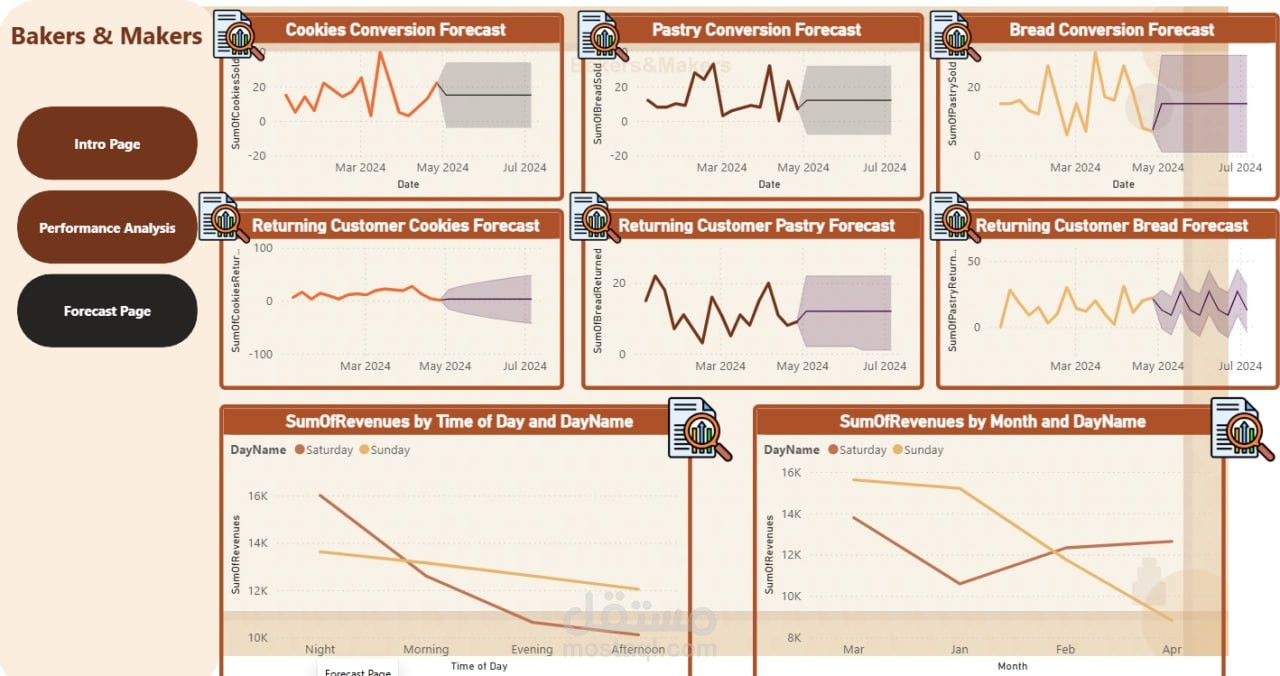
Designed and developed an interactive Power BI dashboard to analyze the performance of a bakery business and provide clear insights into sales, customer behavior, and marketing performance.
The dashboard tracks key performance indicators such as Total Revenue, Total Conversions, Total Ad Spend, and Revenue per Conversion. It also analyzes revenue across different bakery services, customer types, days, and times of day.
A dedicated forecasting section was created to visualize future trends in conversions and returning customers for different product categories, including Bread, Pastry, and Cookies.
Key features:
- Revenue and conversion KPI tracking
- Revenue analysis by product/service
- Customer analysis by new and returning customers
- Performance analysis by time of day and day of week
- Advertising spend analysis
- Revenue per conversion measurement
- Interactive filters and navigation
- Sales and conversion forecasting
- Custom Power BI dashboard design
Tools Used: Power BI, Power Query, DAX, Data Visualization