Sales Performance Analysis for Online Stores
تفاصيل العمل
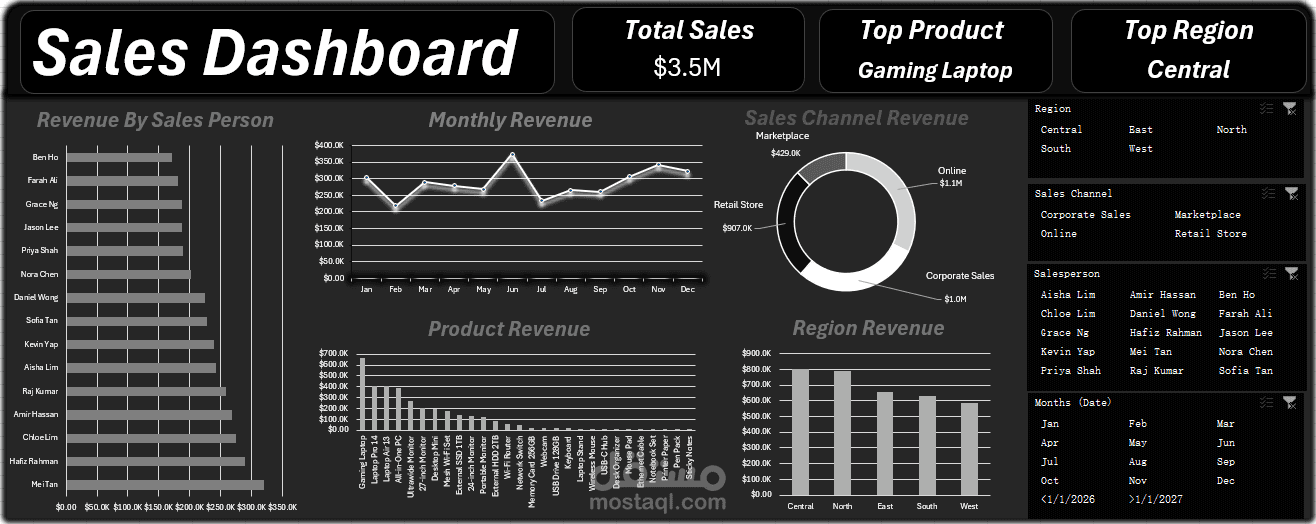
Interactive Sales Dashboard in Power BI – Sales Performance Analysis for Online Stores & Businesses
I designed an interactive sales dashboard that gives business owners a complete view of their sales performance on a single screen, so they can see where revenue comes from and what needs improvement
The dashboard answers:
• What are total sales? ($3.5M)
• Which product sells the most? (Gaming Laptop)
• Which region generates the highest revenue? (Central)
• Which sales channel performs best: Online, Corporate, Retail, or Marketplace?
• Who are the top salespeople, and how does revenue trend month by month?
What's inside:
• KPI cards for the key numbers
• Revenue by Salesperson: team performance ranking
• Monthly Revenue: yearly trend, with peak and slow seasons
• Sales Channel Revenue: revenue split across channels
• Product Revenue: best and worst performing products
• Region Revenue: side-by-side regional comparison
• Slicers for Region, Sales Channel, Salesperson, and Month, with all visuals updating together
Tools used: Power BI, Power Query for data cleaning and preparation, DAX for measures, and a clean dark theme that's easy to read.
Benefits for your business:
• Data-driven decisions instead of guesswork
• Know which products and channels deserve more investment
• Track team performance easily
• Save hours on manual reporting
I can build a dashboard like this on your own store data (Shopify, WooCommerce, Excel, or any other source) and tailor it to your needs.