Sales Dashboard
تفاصيل العمل
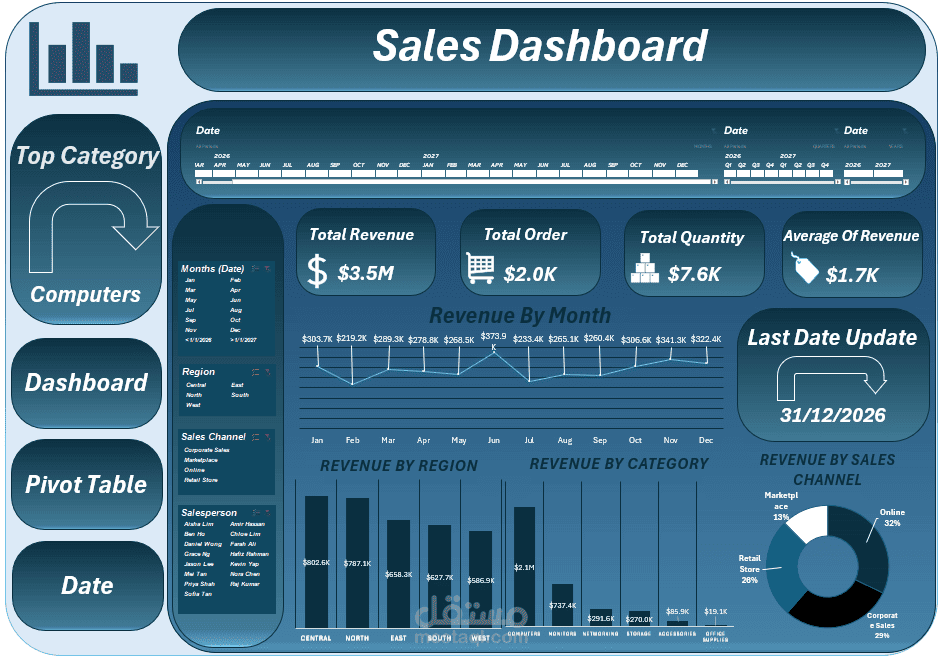
Sales Dashboard – Power BI
Developed an interactive Sales Analysis Dashboard using Power BI to monitor sales performance and provide clear business insights.
• Analyzed total revenue, orders, quantity sold, and average revenue through interactive KPIs.
• Tracked monthly revenue trends to identify changes in sales performance.
• Compared revenue across different regions and product categories.
• Analyzed revenue performance by sales channel, including Online, Corporate Sales, Marketplace, and Retail Store.
• Added interactive filters for date, region, sales channel, salesperson, and category.
• Designed a dynamic dashboard with KPIs, charts, slicers, and performance indicators for easier decision-making.
• Included last update tracking to monitor data freshness.
Tools: Power BI | Data Analysis | Data Visualization | DAX | Interactive Dashboards | KPI Reporting