Real Estate Growth
تفاصيل العمل
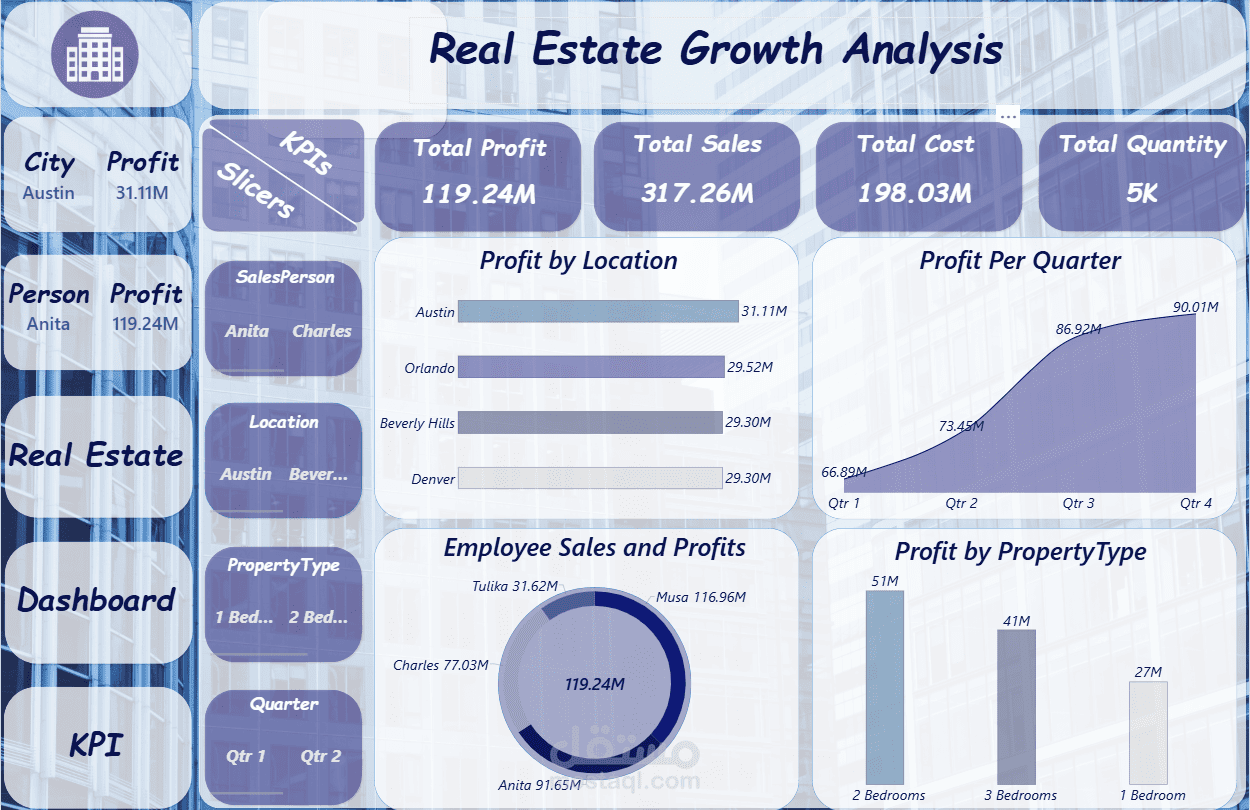
Real Estate Growth Analysis Dashboard – Power BI
Developed an interactive Real Estate Sales & Profit Analysis Dashboard using Power BI to monitor business performance and identify key growth trends.
• Analyzed total sales, profit, costs, and quantity sold using interactive KPIs.
• Compared profit performance across different locations such as Austin, Orlando, Beverly Hills, and Denver.
• Analyzed quarterly profit trends to identify business growth patterns.
• Evaluated sales and profit performance by employee/salesperson.
• Compared profitability across different property types and bedrooms.
• Added interactive slicers for Salesperson, Location, Property Type, and Quarter.
• Designed a user-friendly dashboard focused on business insights, performance monitoring, and data-driven decision making.
Tools: Power BI | Data Cleaning | Data Analysis | Data Visualization | DAX | Interactive Dashboards