Designing Dashboard
تفاصيل العمل
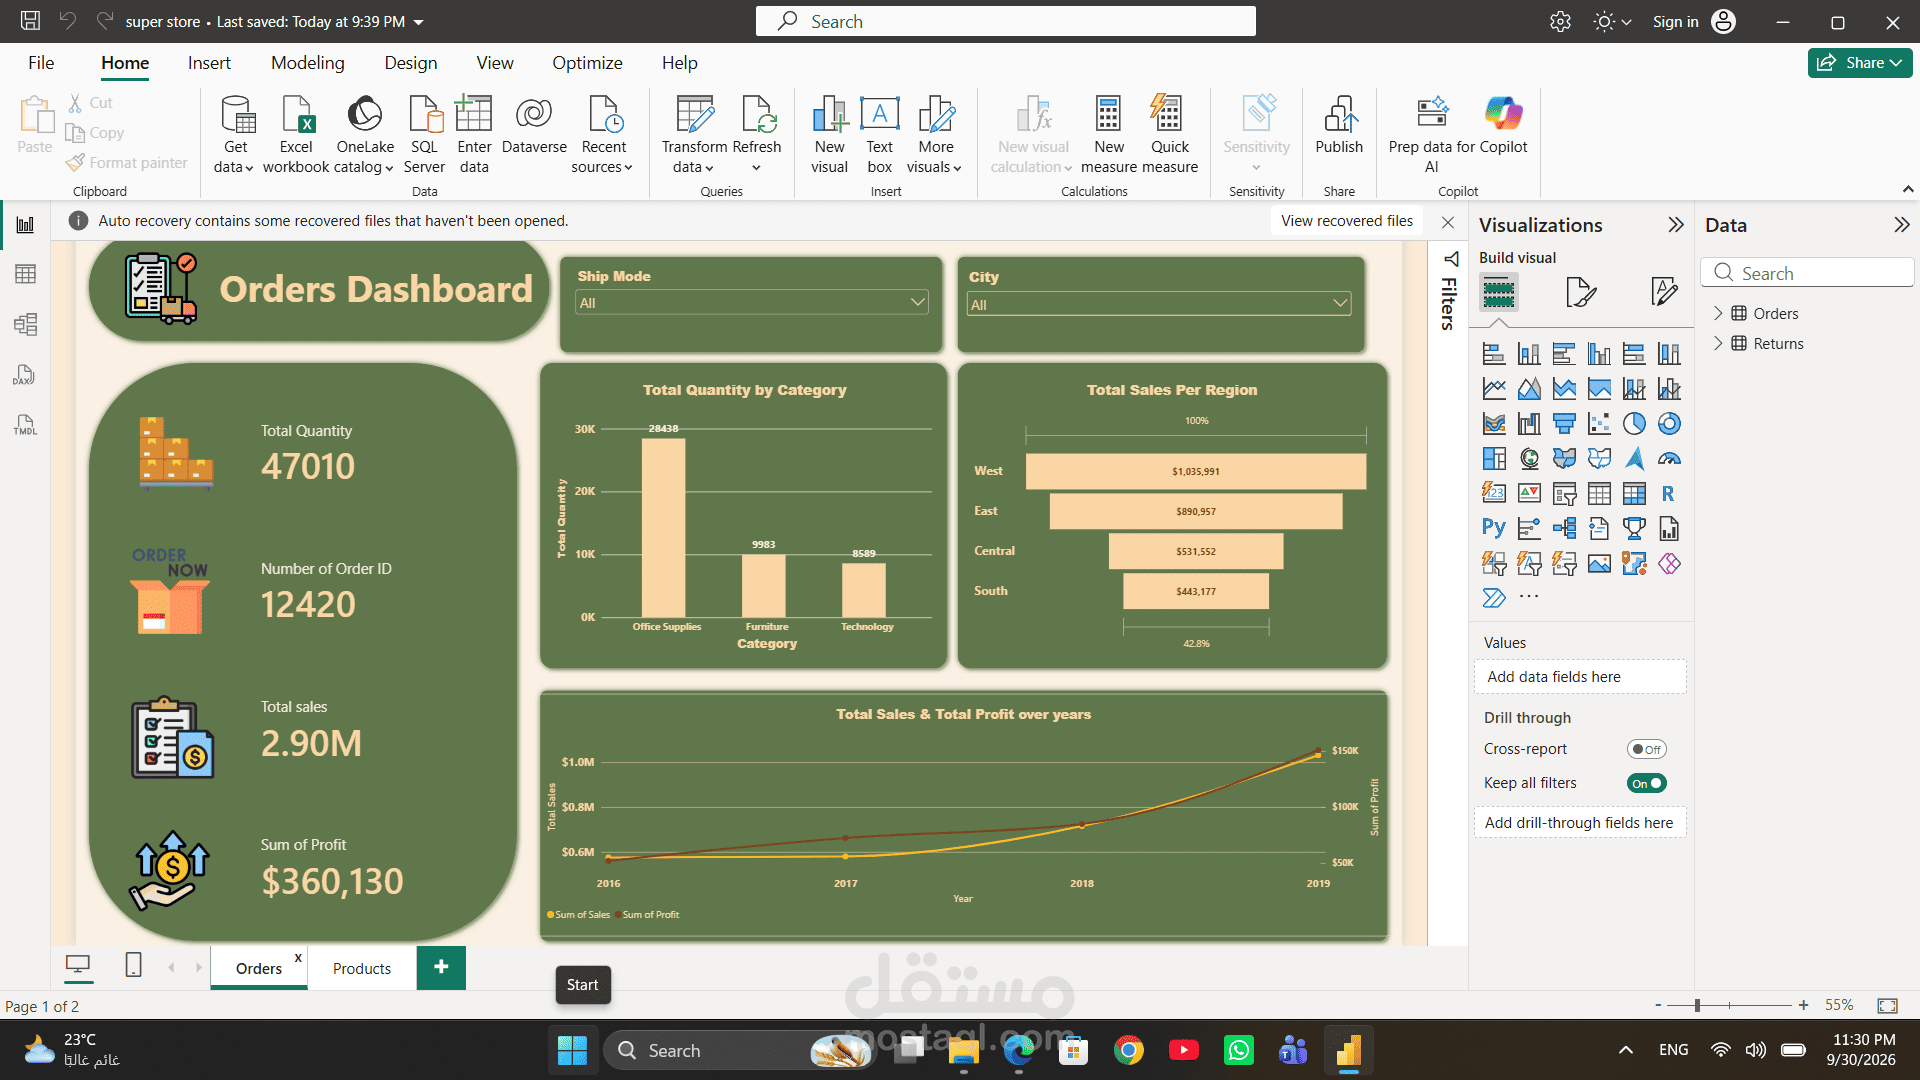
Created an interactive **Super Store Sales Dashboard using Power BI** to analyze business performance and extract useful insights from sales data.
The project includes:
* Analyzing **Sales, Profit, Quantity, and Orders**.
* Tracking sales and profit trends over time.
* Analyzing **Categories and Sub-Categories** based on quantity.
* Comparing sales performance across different **Regions and States**.
* Analyzing **Shipping Modes** and their quantities.
* Using interactive visuals and filters to make the dashboard easy to explore and understand.
The dashboard transforms raw sales data into clear and interactive visualizations that support better understanding of business performance.