Uper project
تفاصيل العمل
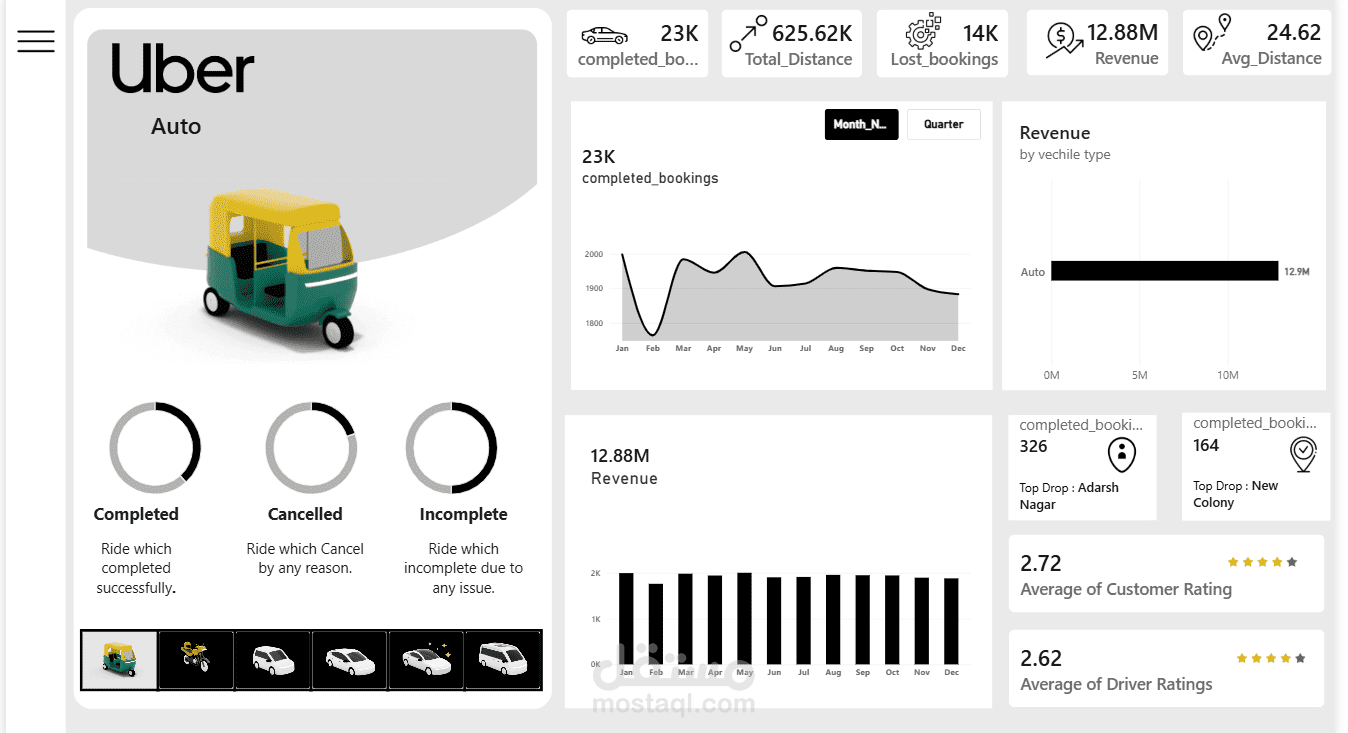
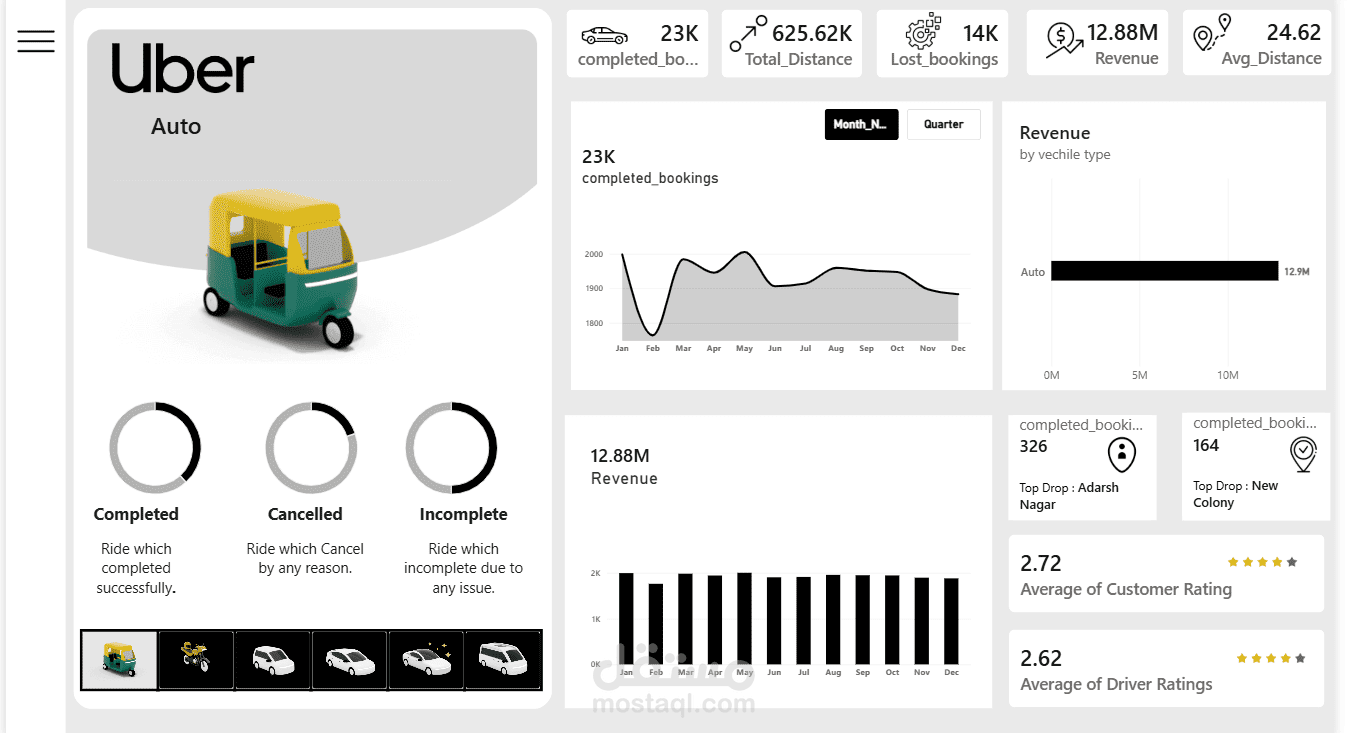
Uber Ride Analytics Dashboard
Developed an interactive Uber Ride Analytics Dashboard to analyze booking performance, revenue, ride completion, cancellations, customer and driver ratings, and trip distance. The dashboard provides insights into monthly and quarterly booking trends, revenue by vehicle type, ride status, and top pickup and drop-off locations. Interactive filters and visualizations were used to make the dashboard easy to explore and support data-driven business decisions.
Tools: Power BI, Data Analysis, Data Visualization, Dashboard Design