Udemy Courses Analysis
تفاصيل العمل
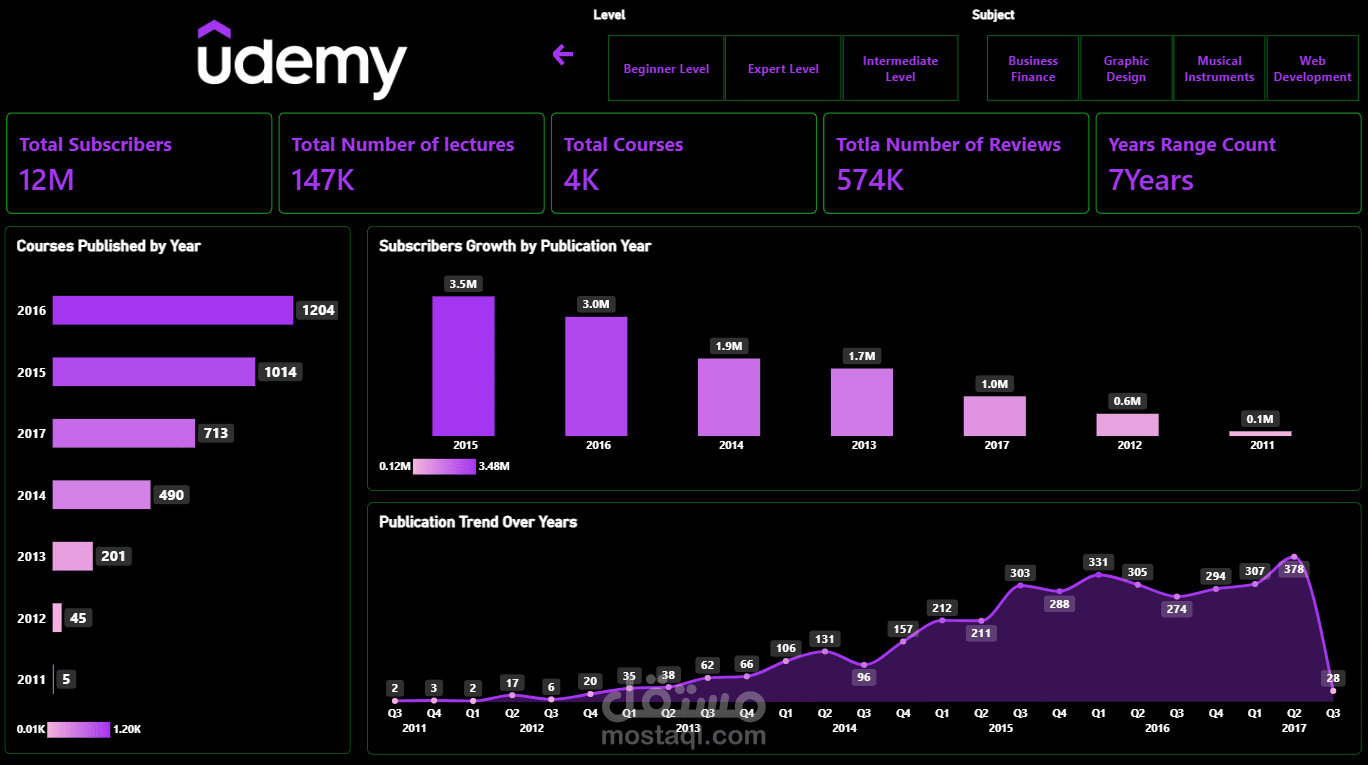
📊 **Udemy Courses Analysis Dashboard | Power BI Project**
المشروع كان عبارة عن تحليل بيانات Udemy بهدف فهم الـ **courses performance, subscribers behavior, reviews, content duration, and publication trends**.
استخدمت **Power BI** لبناء Interactive Dashboard يساعد في تحويل الـ raw data إلى meaningful insights من خلال:
🔹 **KPIs** لعرض أهم الـ metrics بشكل واضح
🔹 تحليل الـ **Total Subscribers & Total Courses**
🔹 مقارنة الـ **Course Levels** ومعرفة توزيع المحتوى
🔹 تحليل العلاقة بين **Content Duration & Subscribers**
🔹 **Top Courses** حسب عدد المشتركين ومدة المحتوى
🔹 تحليل **Publication Trends over the years**
🔹 تحليل الـ **Reviews & Subscribers**
🔹 Interactive filters & slicers للوصول للـ insights بسهولة
أكتر حاجة استفدت منها في المشروع هي إني مش بس بعمل visualization للـ data، لكن بحاول أفهم:
**What happened? → Why did it happen? → What can we learn from the data?**
المشروع ده ساعدني أطور أكتر في **Data Cleaning, Data Modeling, DAX, Data Visualization & Storytelling** داخل Power BI.
Still learning, still building, and always looking for new datasets to turn into useful insights. 📈