Sales Performance Analysis Dashboard
تفاصيل العمل
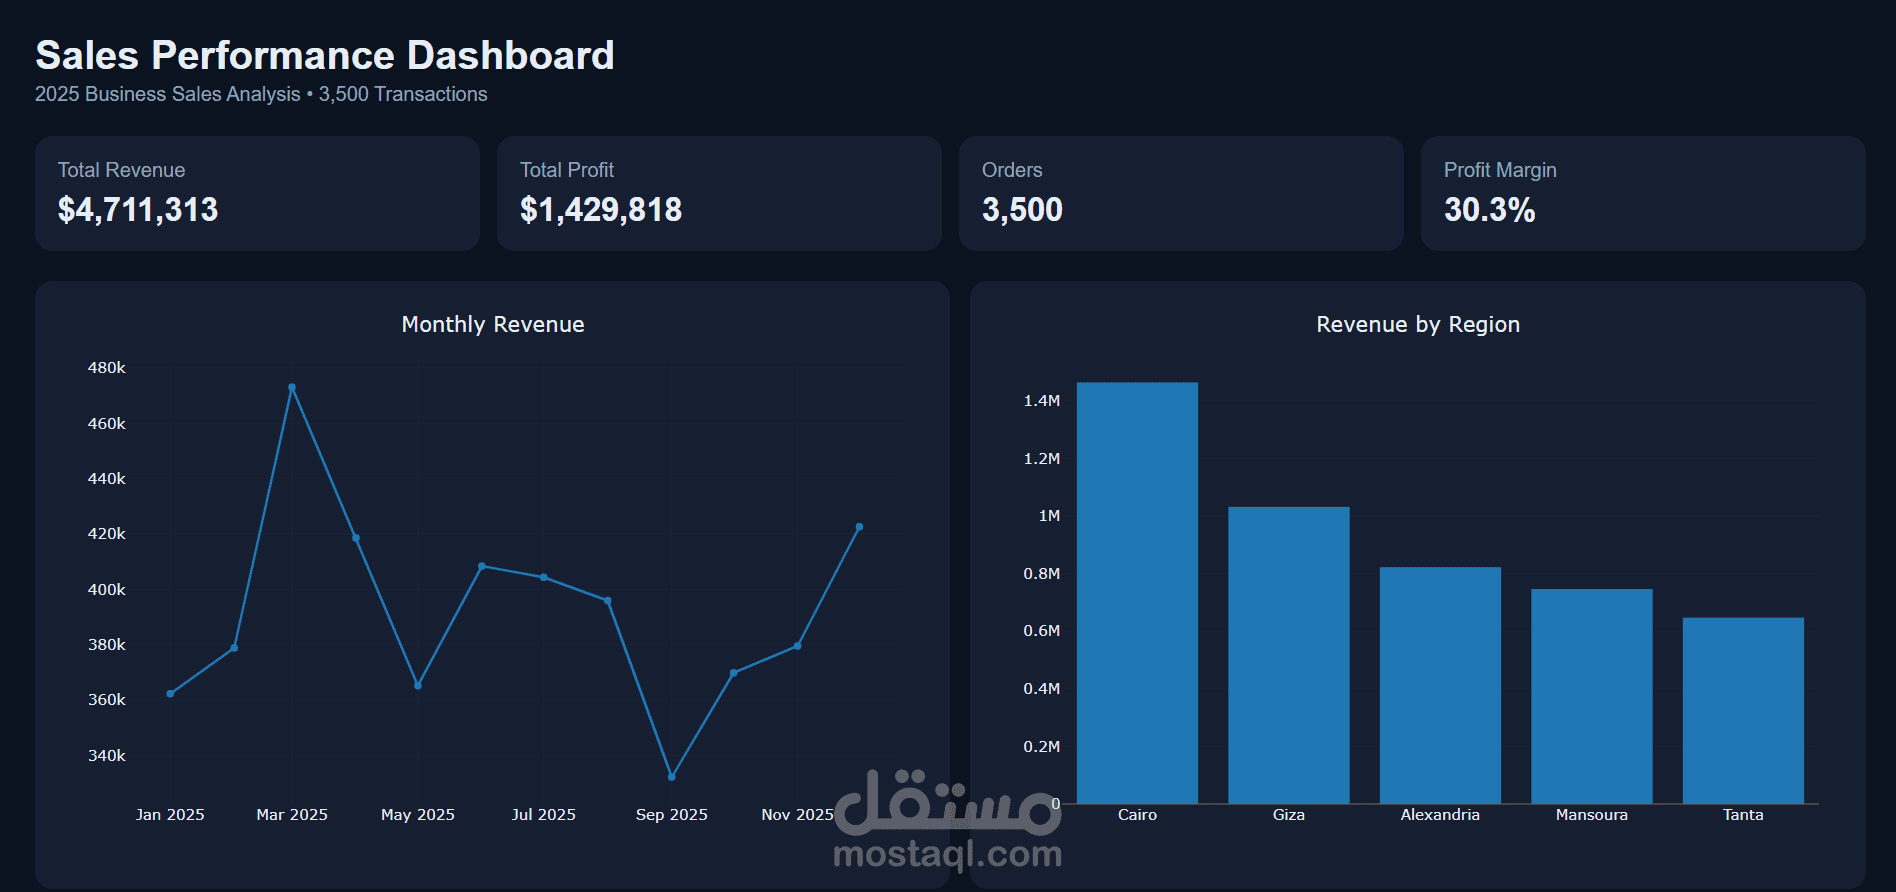
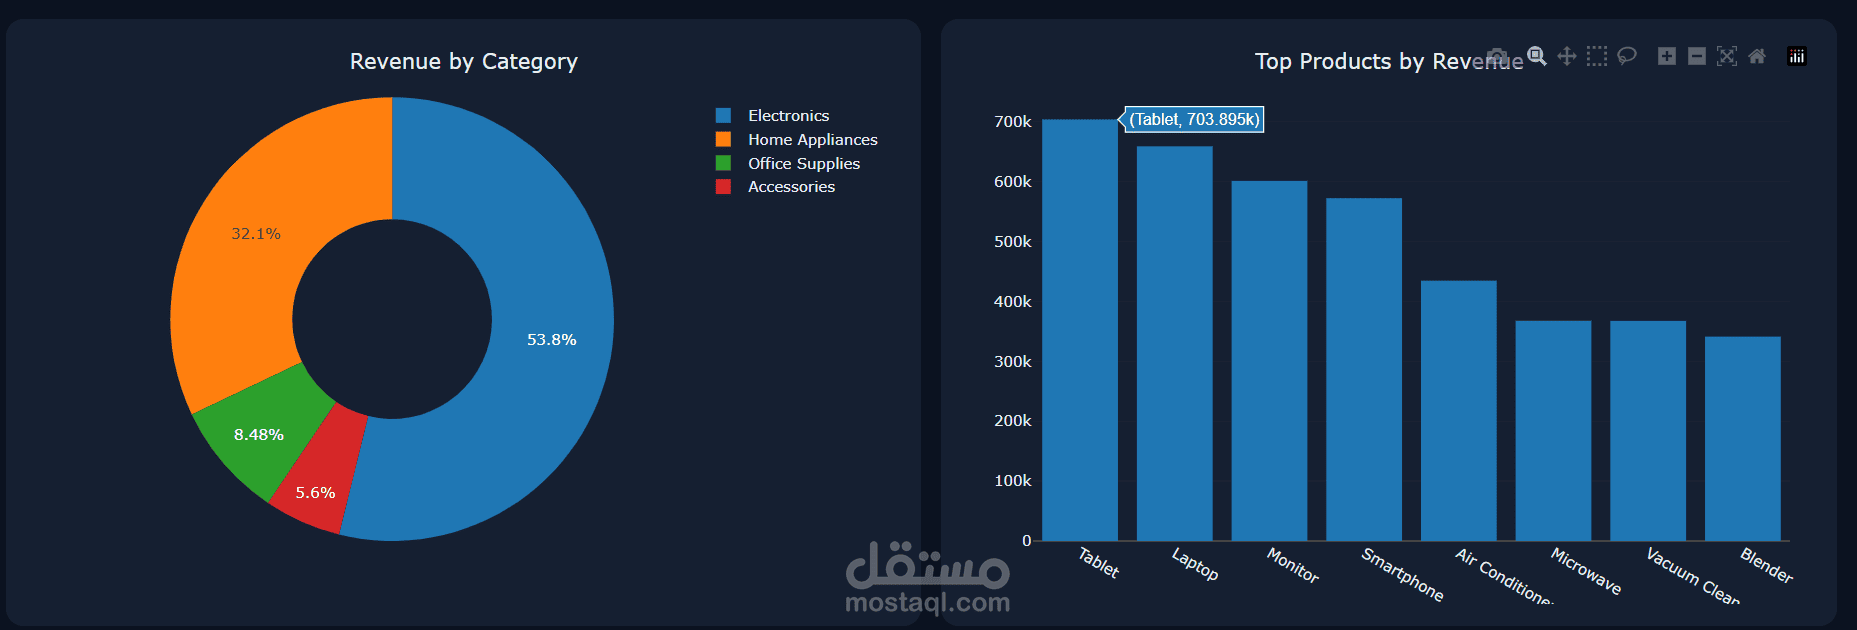
nteractive Sales Performance Analysis Dashboard built using Python, Pandas, Plotly, and Streamlit.
The project analyzes sales transactions to provide a clear view of revenue, profit, orders, product performance, category contribution, and regional performance.
Key Features:
Interactive sales KPIs
Monthly revenue trend analysis
Revenue and profit analysis
Regional sales performance
Category performance analysis
Top products by revenue
Interactive filters and visualizations
Business insights to support data-driven decisions
Tools: Python, Pandas, NumPy, Plotly, Streamlit