Power BI project
تفاصيل العمل
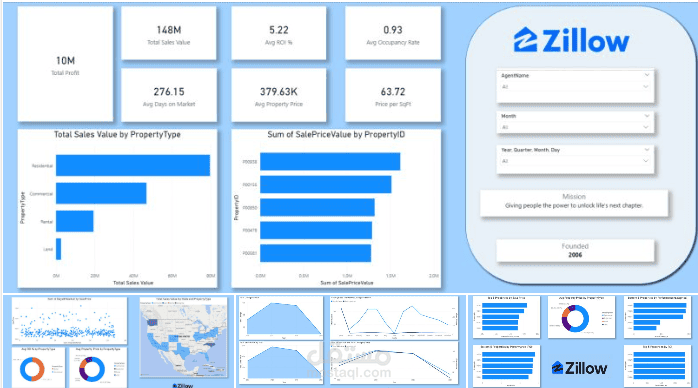
In this project, I worked on:
* Total Sales Value
* Total Profit (NOI)
* Average Property Price
* Average Days on Market
* Price per Sqm
* ROI % (Return on Investment)
* Occupancy Rate
* Sales Growth (Monthly / Yearly)
📈 And created key visualizations such as:
* Top 5 Properties by Sale Price
* Bottom 5 Properties by Performance (ROI / Sales)
* Sales by Property Type
* Sales vs ROI analysis
This project helped me understand how to turn raw data into meaningful insights using Power BI and DAX.