Sales & Inventory Performance Dashboard باستخدام Power BI
تفاصيل العمل
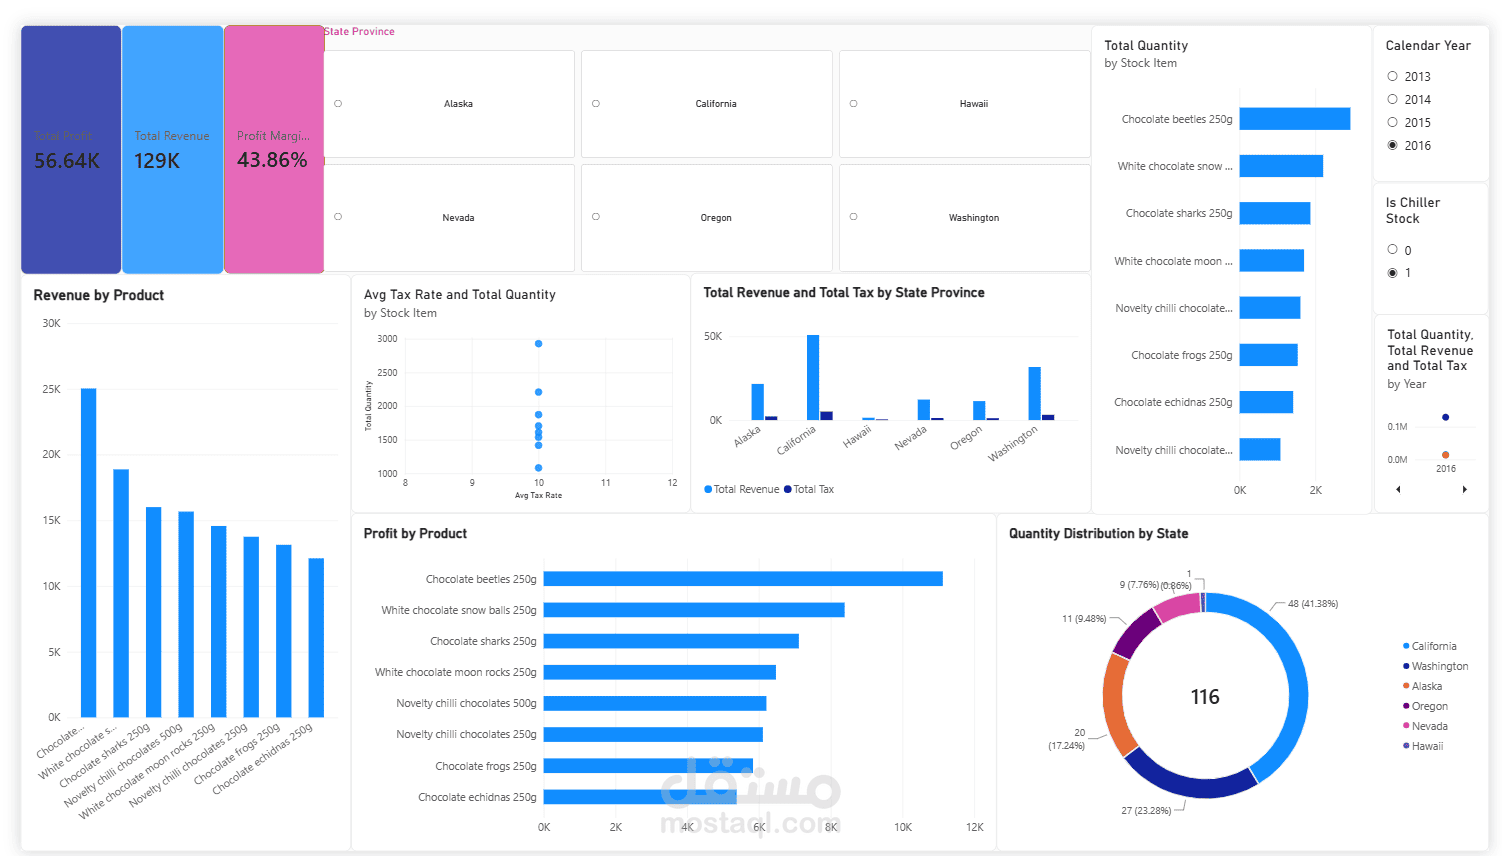
Sales & Inventory Performance Dashboard
An interactive Power BI dashboard designed to analyze sales, inventory, profitability, and tax performance.
The dashboard provides key insights into:
Total Revenue, Total Profit, and Profit Margin
Revenue and profit by product
Quantity and revenue by state
Tax and revenue analysis
Product quantity and stock performance
Year-based analysis with interactive filters
Tools & Skills:
Power BI | Power Query | DAX | Data Analysis | Data Visualization | KPI Analysis | Interactive Dashboards