Bike_Sales
تفاصيل العمل
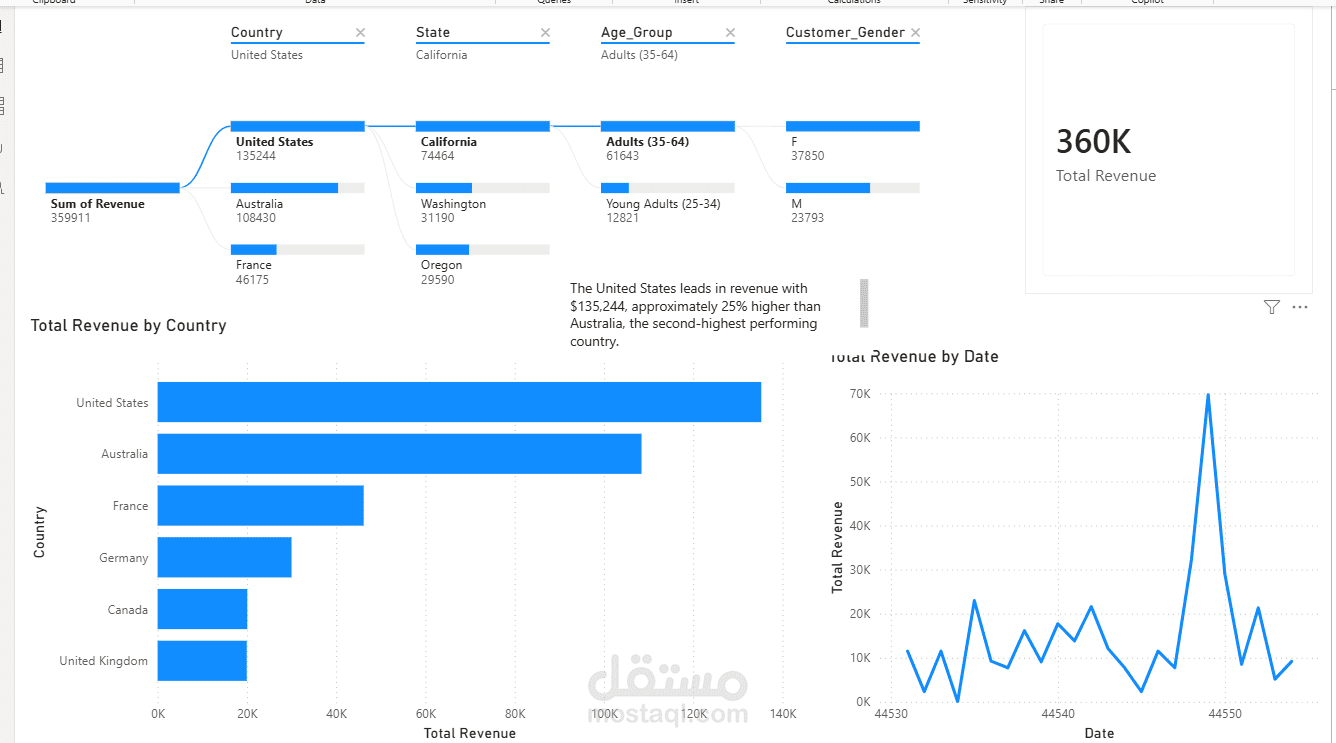
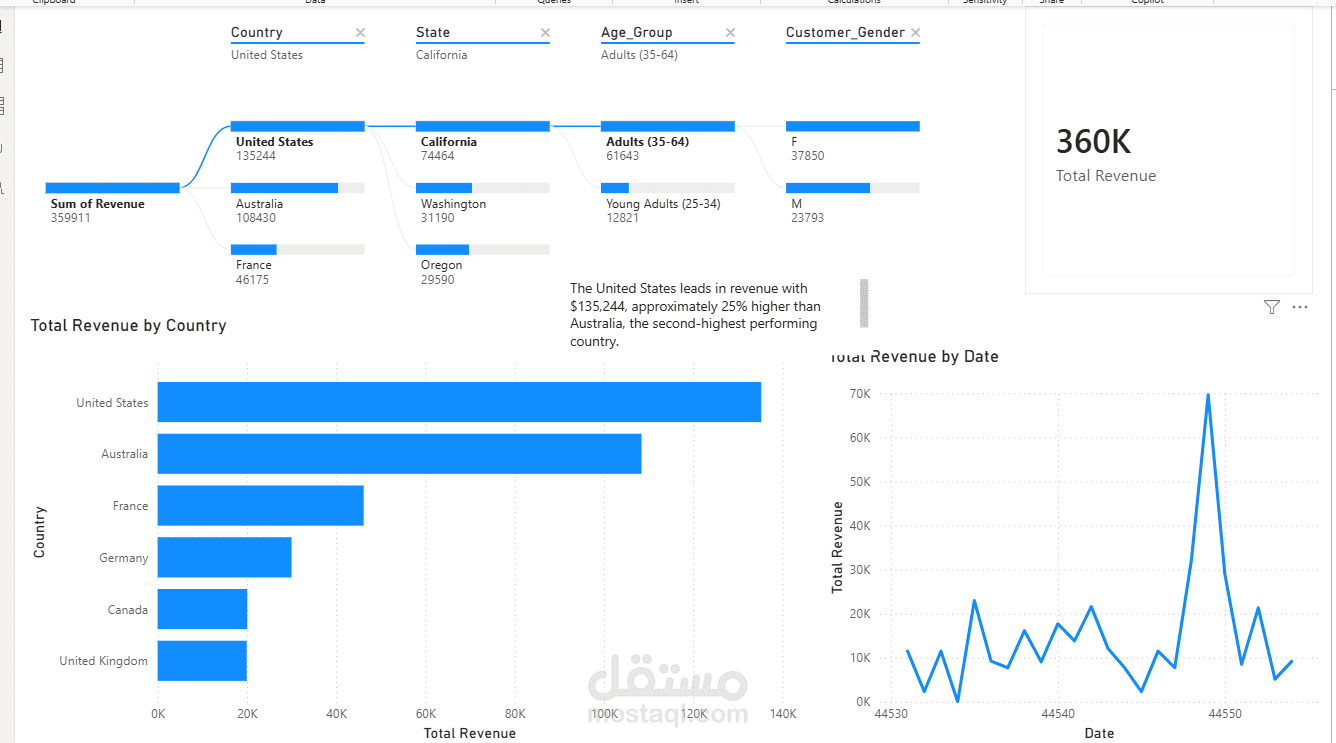
Part 0 — Clean the Data (Power Query)
Select the column → Transform → Format → , then
Fix the 4 messy column headers (Unit_Cost, Unit_Price, Profit, Cost) — rename each to remove the extra spaces
Select → right-click the data type icon → → Decimal Number → English (United States)
Ignore the Month column entirely — use the column for any date-based grouping instead
Part 1 — KPI Card
Create measure: Total Revenue
Add a visual showing it
Part 2 — Trend Line Chart
Add a
X-axis: Date
Y-axis: Total Revenue measure
Part 3 — Country Comparison Bar Chart
Add a
Axis: Country
Values: Total Revenue measure
Sort descending
Format → Data colors → → highlight the top country in a distinct color
Part 4 — Decomposition Tree
Add a
Analyze: Sum of Revenue
Explain by: Country, State, Age_Group, Customer_Gender
Drill into the top country → top state → top age group
Part 5 — Tooltip + Annotation
Create a new page → Page settings → → keep it small
Add a Card showing Profit Margin % on this tooltip page
On your main page, assign this tooltip: click the bar chart → Format → Tooltip → Type: → select your tooltip page
Add a on the main page with one sentence stating a specific insight
Part 6 — Written Story Narrative
Write 4–6 sentences answering:
What's the headline number?
What does the trend line show?
Which country leads, and by how much?
What does the decomposition tree reveal about why?
What's the one insight to highlights