power query&pivot table
تفاصيل العمل
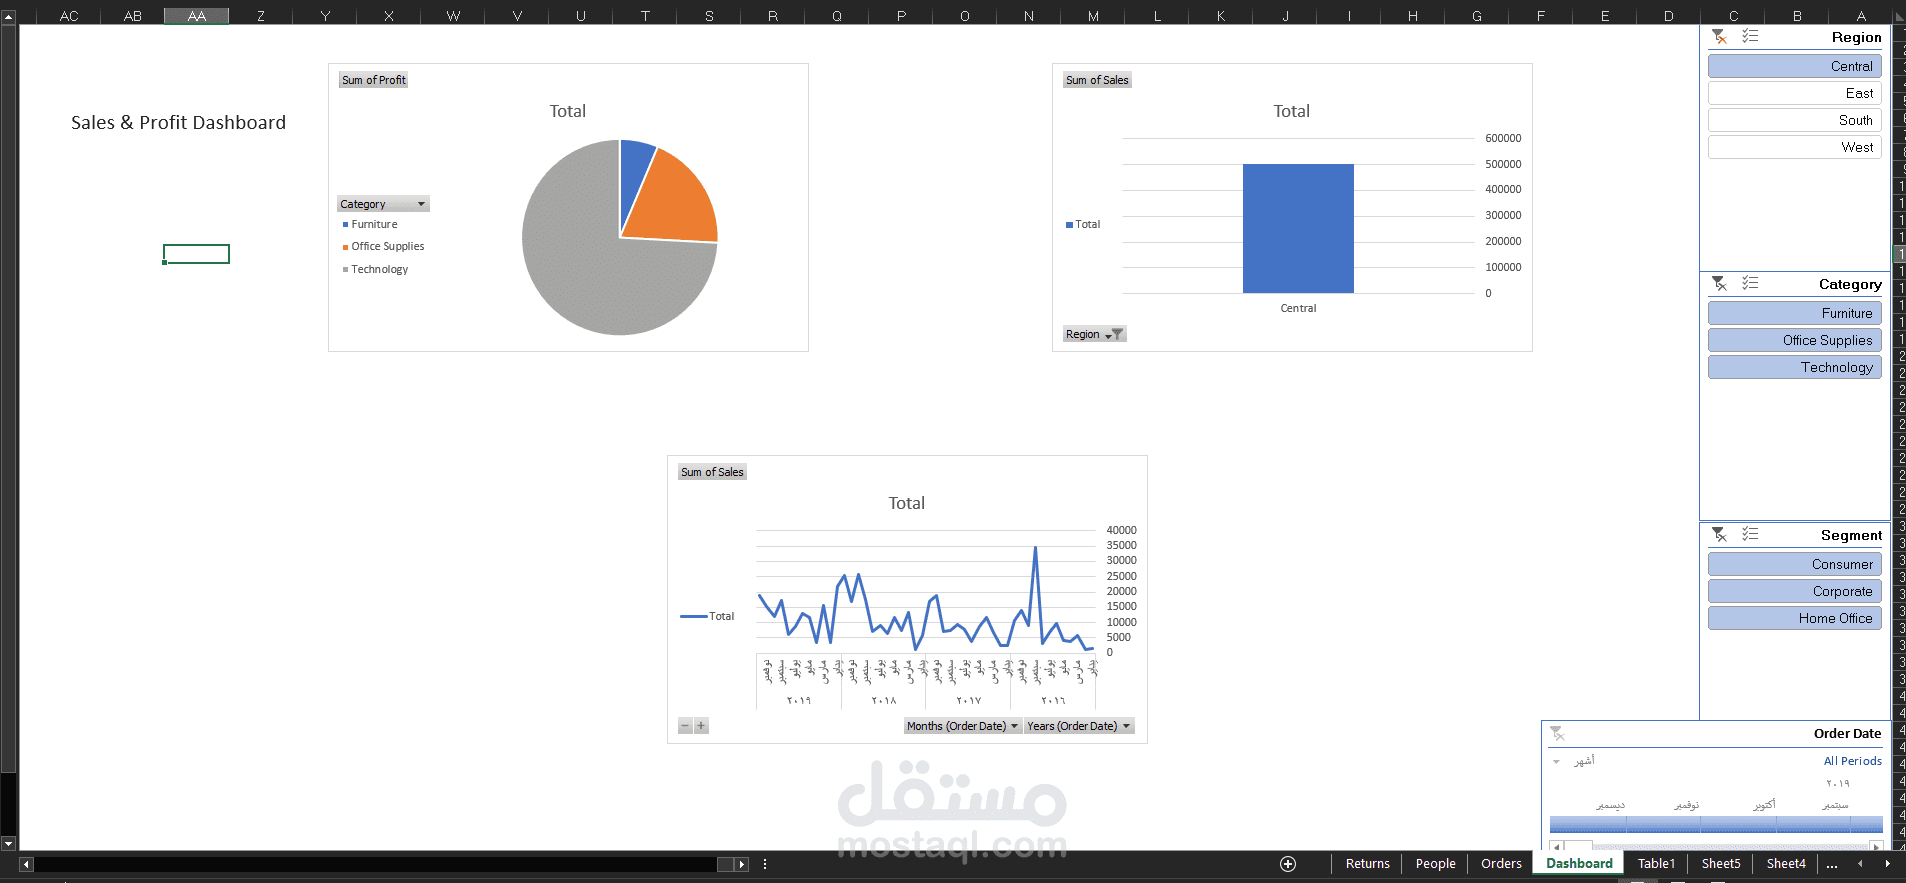
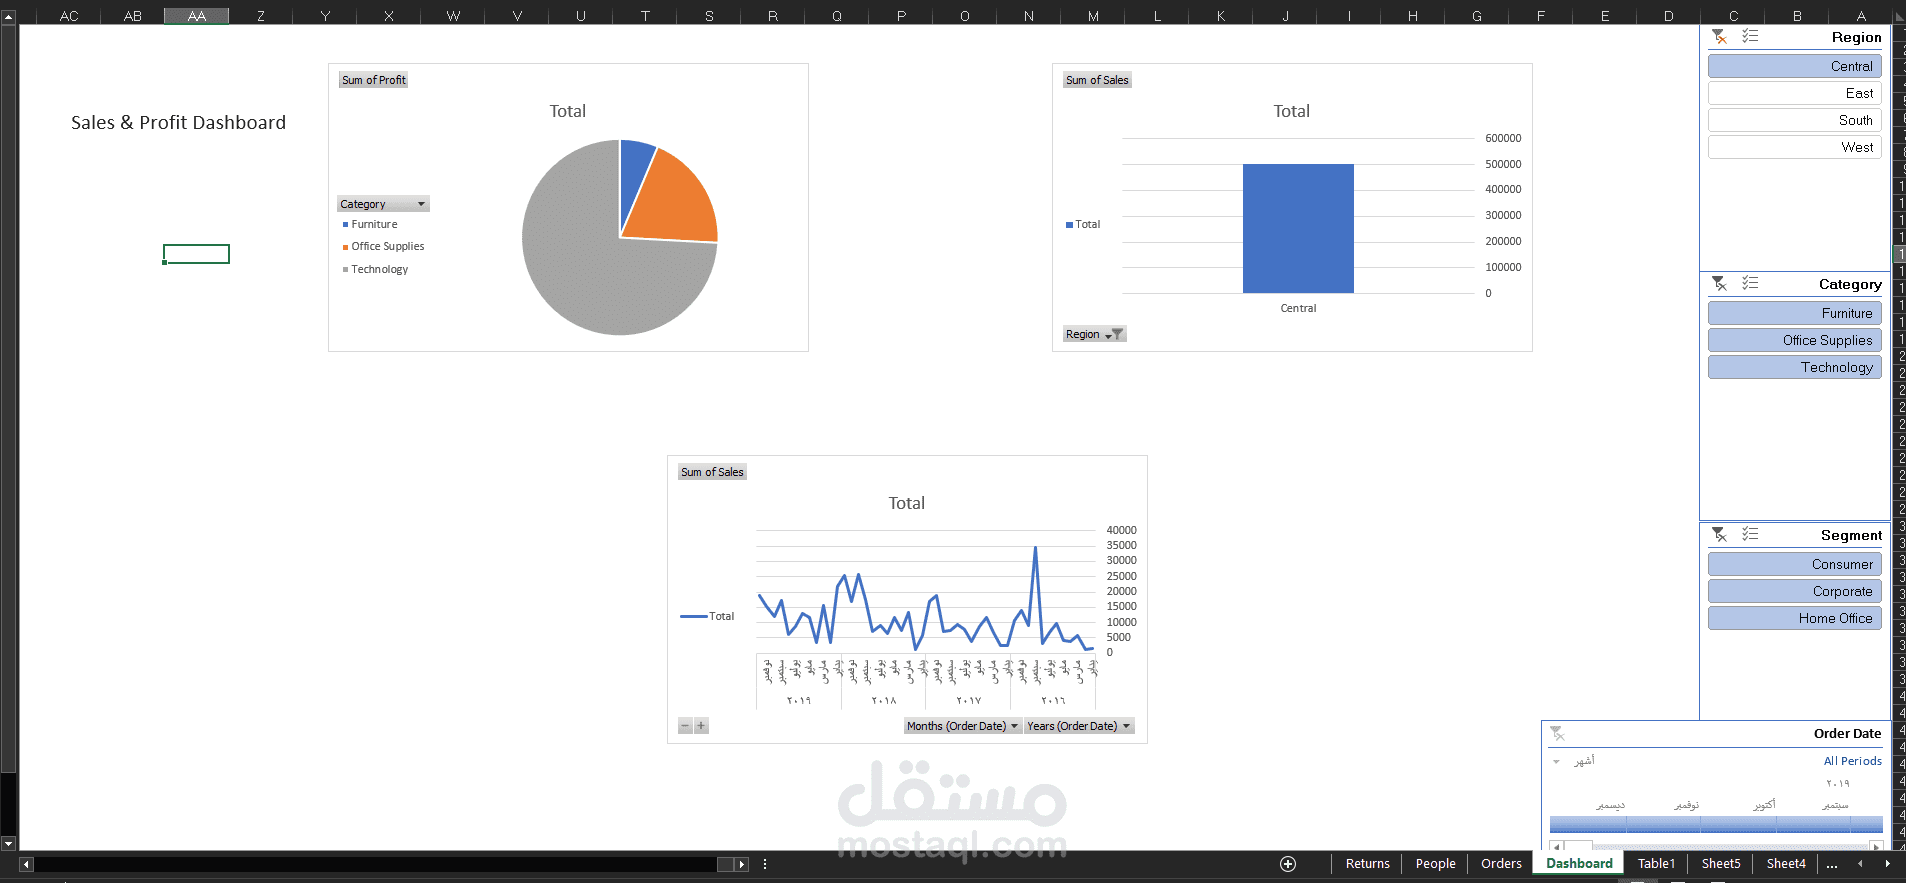
This project focuses on analyzing sales data using Microsoft Excel, Power Query, and Pivot Tables based on the Sample – Superstore 2019 dataset.
The work included cleaning and preparing the data using Power Query by removing duplicates, handling missing values, standardizing category names, and correcting data types. Calculated columns such as Profit Margin and Sales Category were also created.
Several Pivot Tables were built to analyze regional sales, category profitability, customer segments, and monthly sales trends. Pivot Charts were created to present the results using different types of charts.
Slicers were added for Region, Segment, and Category to make the analysis interactive. Finally, a one-page management dashboard was designed to display important KPIs, including Total Sales, Total Profit, and Top Region, in a clear and interactive way.