Sales & Profit Analysis Dashboard
تفاصيل العمل
🚀 Executive & Product Sales Analytics Dashboard (Power BI)
I recently completed an end-to-end Power BI project designed to deliver an automated reporting and KPI analysis solution for management. The goal was to transform raw sales data into interactive executive and product-level dashboards to drive data-informed decision-making.
💡 Key Project Highlights
1️⃣ Data Cleaning & ETL (Power Query)
- Imported and cleaned raw data across multiple connected datasets: Orders, People, and Returns.
- Handled missing values, formatted data types, and prepared structured tables for modeling.
2️⃣ Data Modeling & Date Intelligence
- Built a robust Data Model establishing star schema relationships between facts and dimensions.
- Created a dedicated Date Table enabling dynamic time-intelligence calculations across Years, Quarters, Months, and Year-Month trends.
3️⃣ Advanced DAX Measures & Metrics
Engineered key business measures to evaluate overall performance and product profitability:
- Total Sales: $2.30M
- Total Profit: $286.40K
- Profit Margin %: 12.47%
- Year-over-Year (YoY) Growth %: 46.88%
- Avg Profit per Product: $154.81
- Total Products: 2K+ unique items
- Running Total & Time Intelligence Measures
4️⃣ Calculated Columns
- Profitability Category: Segmented performance into distinct profitability tiers.
- Shipping Delay: Calculated order-to-shipment duration to monitor operational efficiency.
📊 Dashboard Architecture & Visual Breakdown
The report is structured into two main dark-themed interactive pages designed for executive overview and granular product exploration:
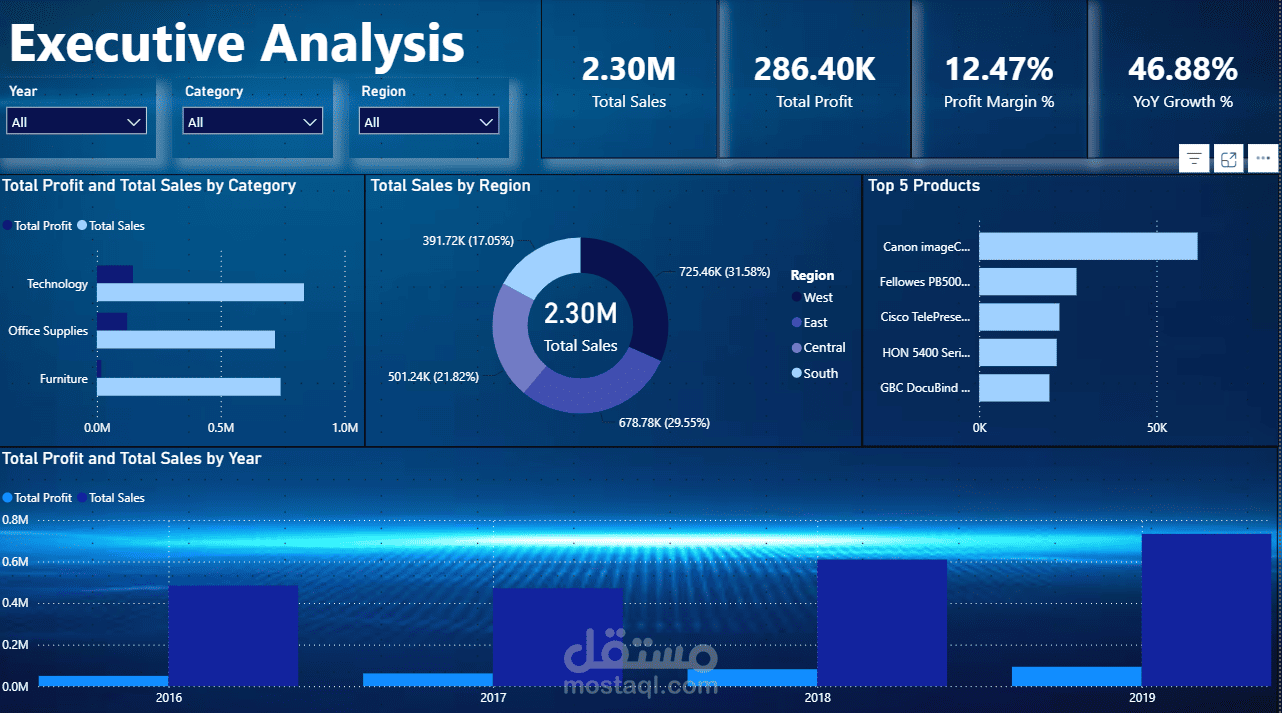
1. Executive Analysis Page
- Executive KPI Banner: Instant high-level view of Total Sales ($2.30M), Total Profit ($286.40K), Profit Margin (12.47%), and YoY Growth (46.88%).
- Regional Sales Distribution: Donut chart breaking down sales by region (West leading at 31.58% / $725.46K, followed by East at 29.55%).
- Category Performance: Dual bar chart comparing Total Sales vs. Total Profit across major categories (Technology, Office Supplies, Furniture).
- YoY Historical Trend: Year-over-year bar chart tracking revenue and profit trajectories from 2016 to 2019.
- Top 5 Products: Horizontal bar chart highlighting top-performing products led by the Canon imageCLASS series.
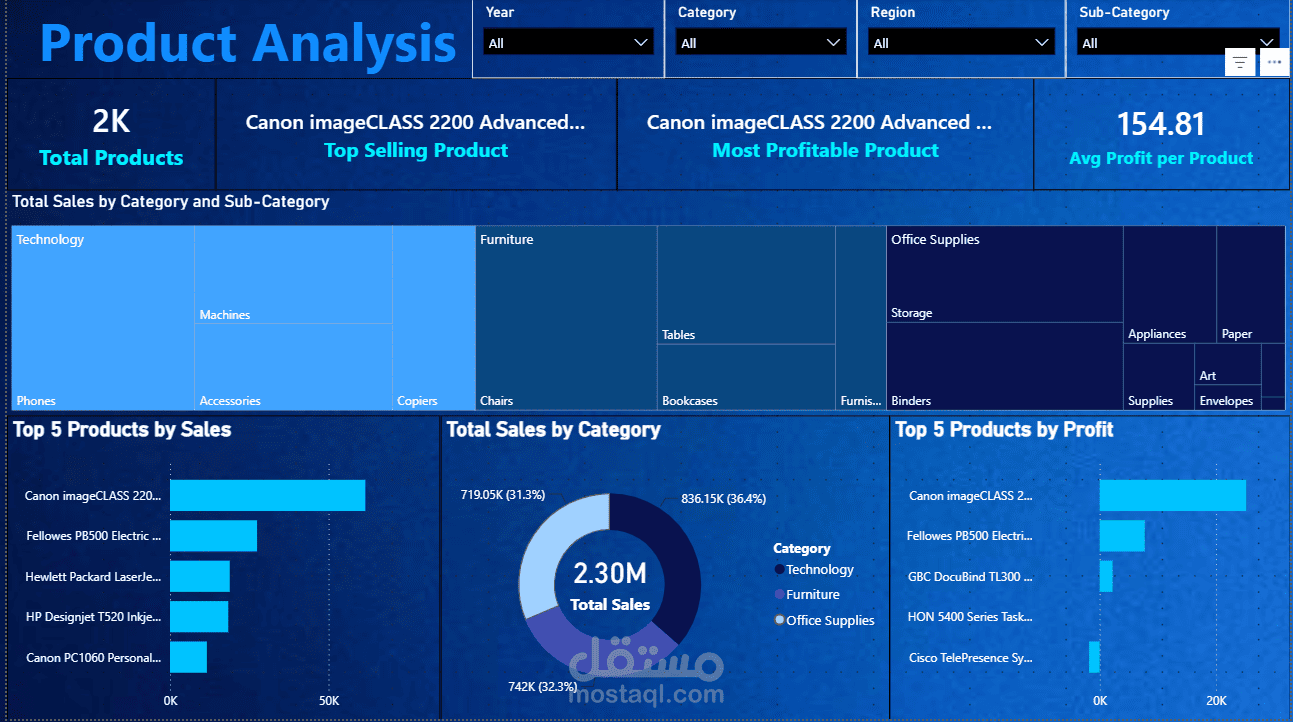
2. Product Analysis Page
- Product Insights Cards: Displays key product indicators including Total Products (2K), Avg Profit per Product ($154.81), and automatically highlights the Top Selling and Most Profitable products (Canon imageCLASS 2200 Advanced).
- Category & Sub-Category Treemap: Visual hierarchy map showing sales distribution across sub-categories like Phones, Machines, Chairs, Tables, Storage, and Binders.
- Sales Breakdown by Category: Donut chart detailing revenue split across Technology (36.4% / $836.15K), Office Supplies (32.3% / $742K), and Furniture (31.3% / $719.05K).
- Top 5 Products by Sales vs. Profit: Side-by-side comparative horizontal bar charts identifying top revenue drivers vs. profit margin generators.
5️⃣ Interactive Features & User Experience (UX)
- Dynamic Filtering & Slicers: Top-level slicers for Year, Category, Region, and Sub-Category allowing cross-page dynamic filtering.
- Drill-Through Capability: Enables deep-dive analysis from macro trends directly into micro product details.
- Modern Visual Design: Applied dark mode aesthetic with consistent color-coding to highlight critical business insights effortlessly.
🎯 Business Impact & Objective
To replace static spreadsheets with an intuitive, real-time analytics platform that accelerates executive decision-making, identifies high-value products, and highlights regional growth opportunities.
🛠️ Tools & Technologies
Power BI | Power Query | DAX | Data Modeling | Business Intelligence | Data Visualization | Advanced Analytics
This project reinforced my hands-on expertise in Business Intelligence, DAX calculations, Data Modeling, and Executive Dashboard Development using Power BI.
#PowerBI #DataAnalysis #BusinessIntelligence #DAX #PowerQuery #DataVisualization #Dashboard #DataAnalytics #MicrosoftPowerBI #ExecutiveDashboard #SalesAnalytics #DataScience