Sales Data Analysis Project | Python & Pandas
تفاصيل العمل
1. Data Cleaning & Preparation
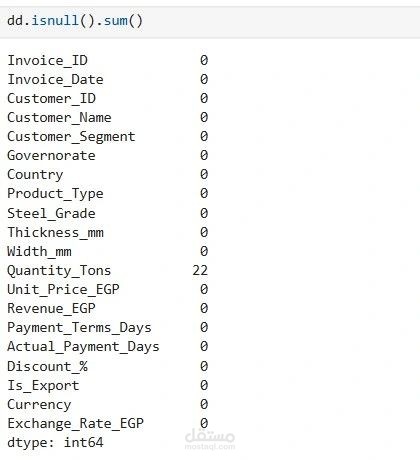
I started by inspecting the dataset and checking the data types and missing values:
dd.info()
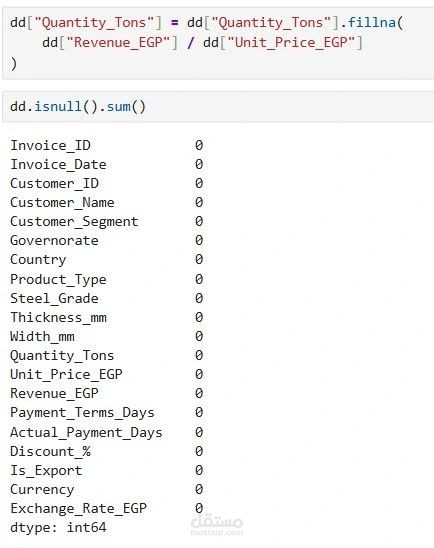
dd.isnull().sum()
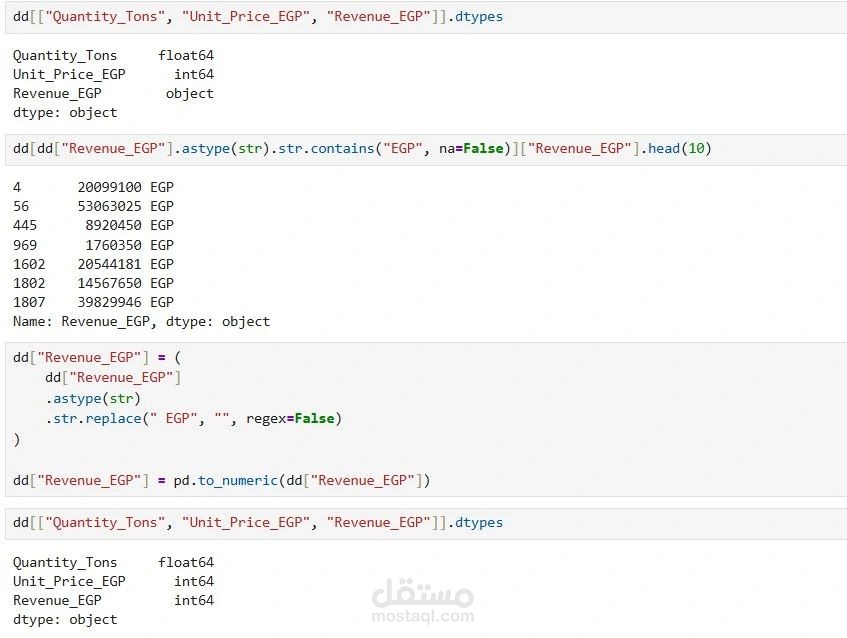
One of the challenges I found was that the Revenue column was not stored as a numeric value. It contained the currency label "EGP", which prevented me from performing numerical calculations directly.
So, I first cleaned the column and converted it into a numeric data type:
dd["Revenue"] = (
dd["Revenue"]
.str.replace("EGP", "", regex=False)
.str.strip()
.astype(float)
)
After converting Revenue into a proper numeric format, I could use it for further calculations and analysis.
I also found missing values in the Quantity column.
Instead of simply removing these records, I used the existing business relationship:
Revenue = Quantity × Unit Price
So I calculated the missing Quantity values using:
dd["Quantity"] = dd["Revenue"] / dd["Unit Price"]
This allowed me to recover the missing values while preserving the available records.
🔹 2. Data Analysis
After cleaning and preparing the data, I analyzed key business questions such as:
- 💰 What is the total Sales?
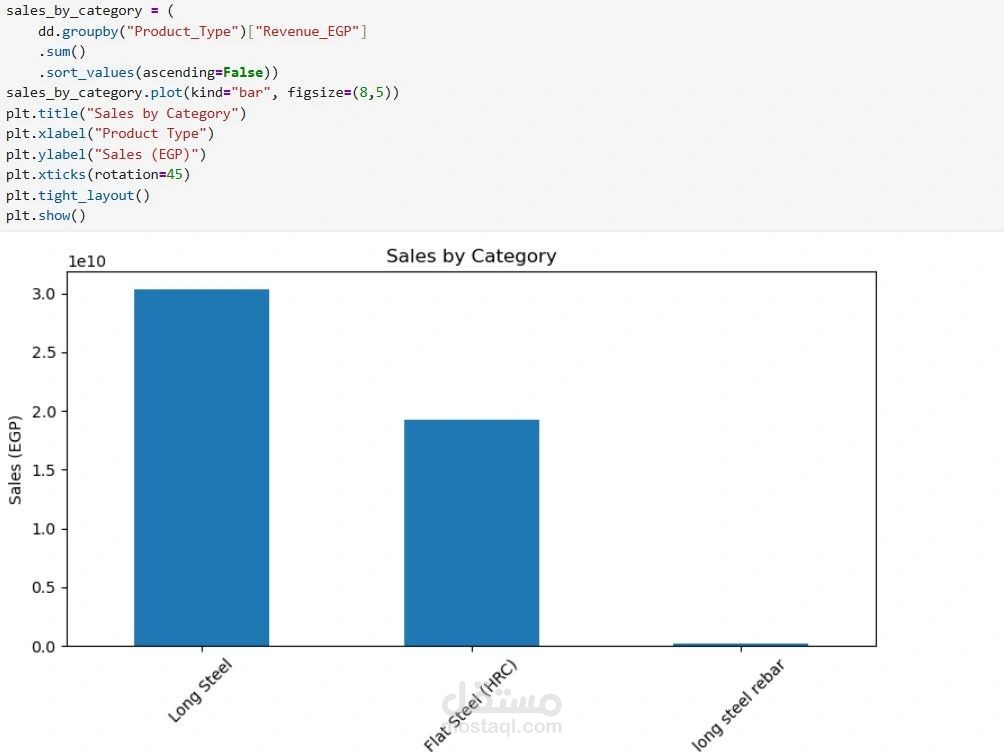
- 📦 Which Category generates the highest Sales?
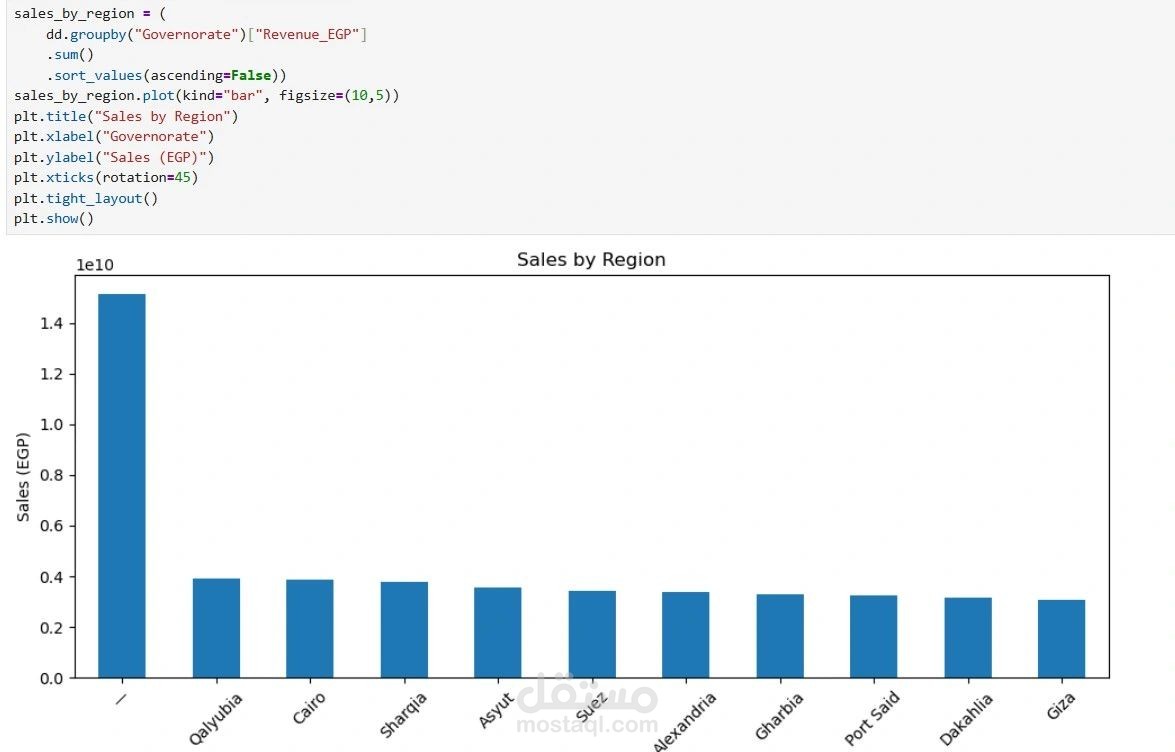
- 🌍 Which Region performs best?
🔹 3. Data Visualization
I created multiple visualizations using Matplotlib, including:
📊 Sales by Category
🛍️ Top Products
🌍 Sales by Region