Bee Market | Sales Performance Dashboard
تفاصيل العمل
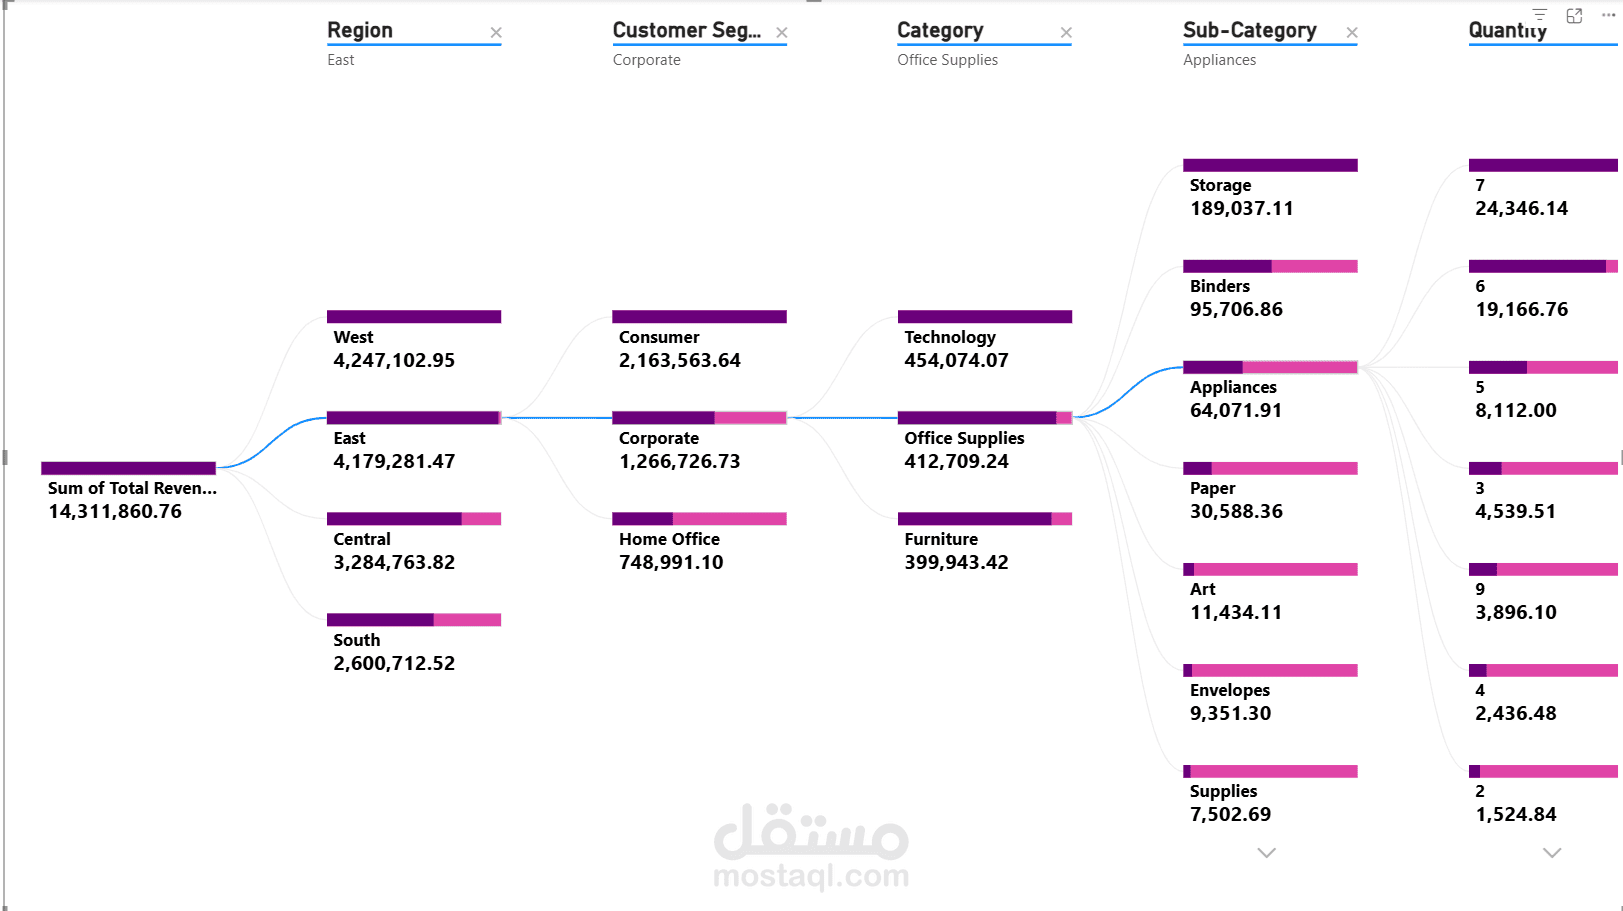
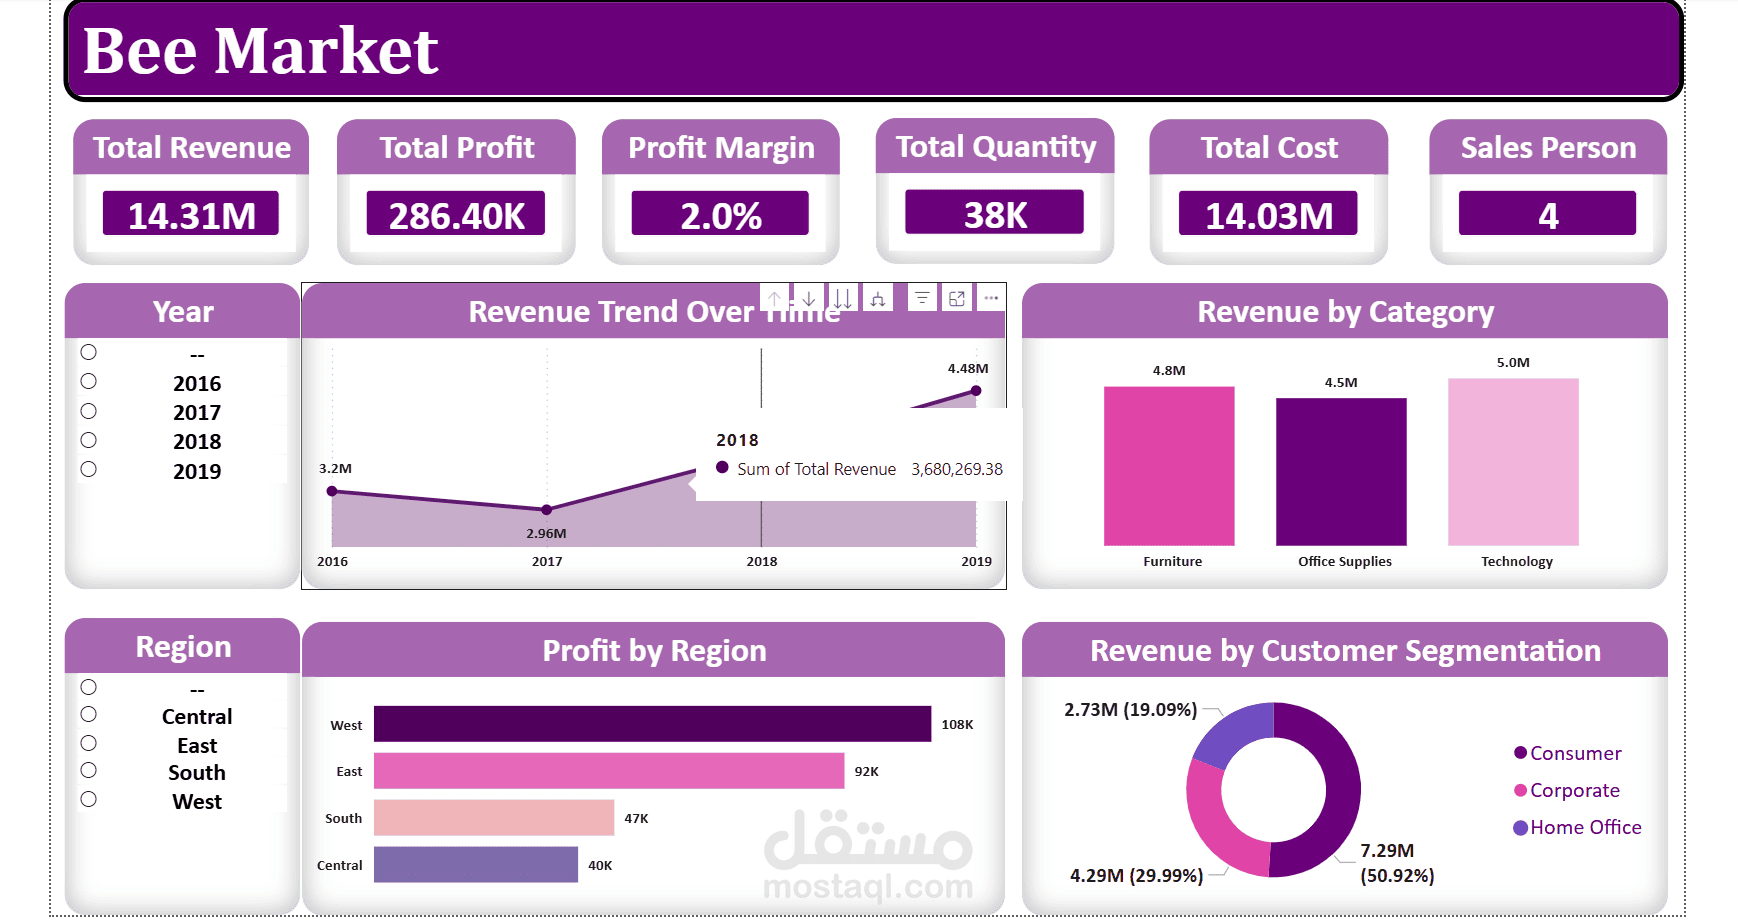
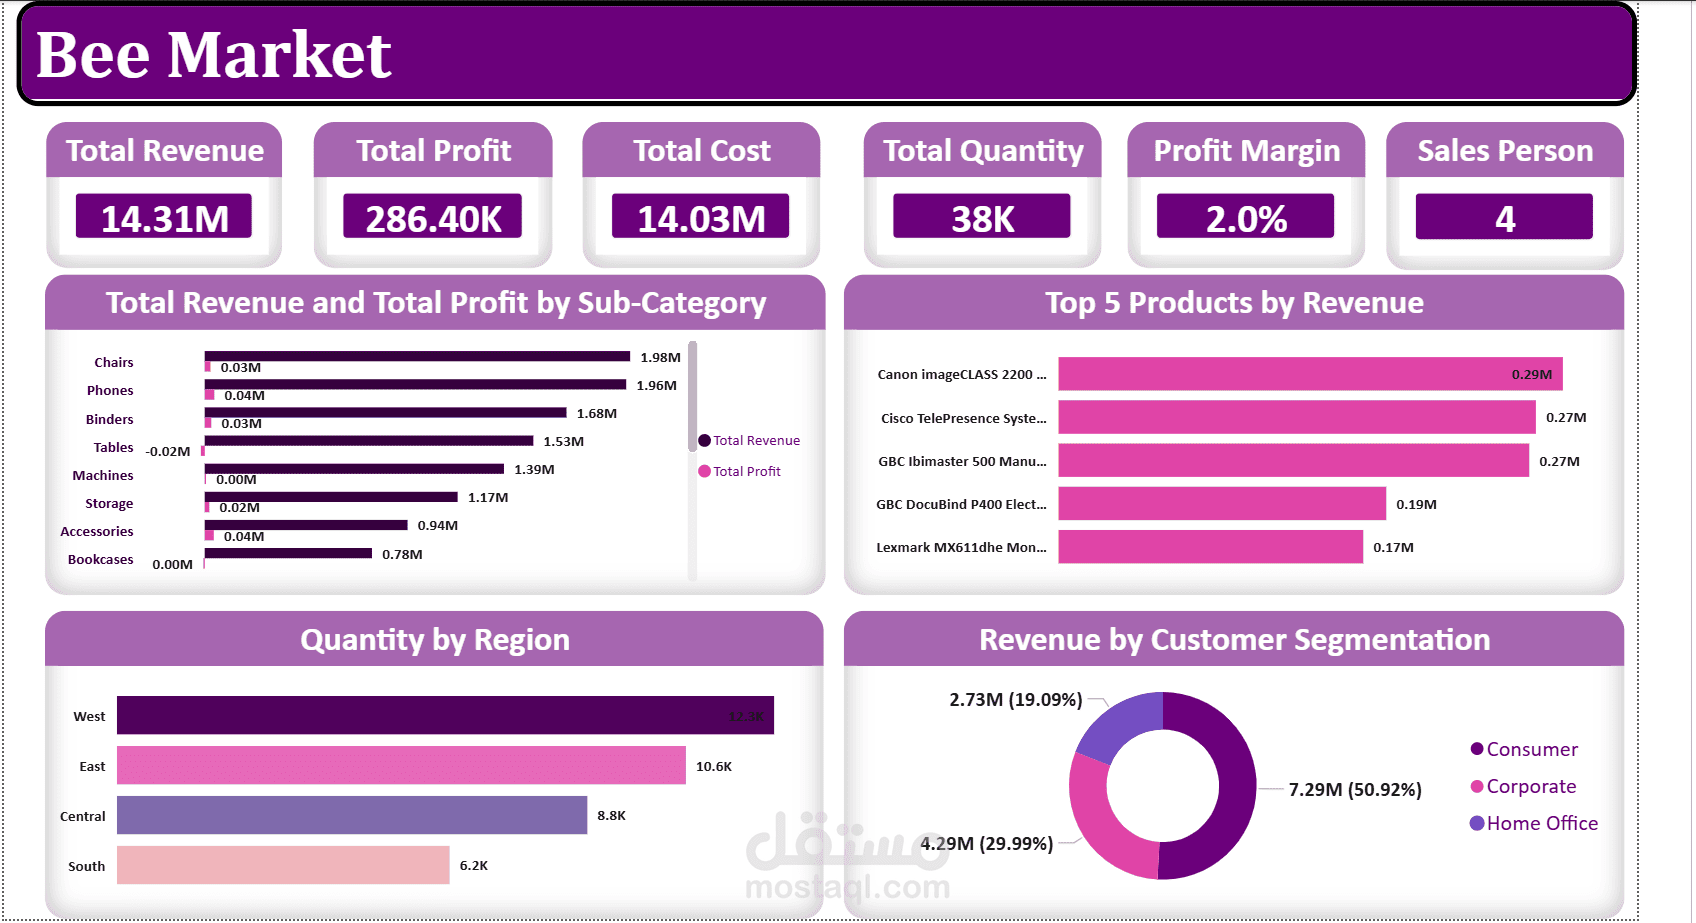
Developed an interactive sales dashboard using Power BI to analyze revenue, profit, cost, and sales quantity. The dashboard provides insights into product performance, regional sales, and customer segments, helping businesses monitor KPIs and understand sales performance.
تم تطوير لوحة معلومات تفاعلية للمبيعات باستخدام أداة Power BI لتحليل الإيرادات والأرباح والتكاليف وكميات المبيعات. وتوفر هذه اللوحة رؤىً حول أداء المنتجات والمبيعات الإقليمية وشرائح العملاء، مما يساعد الشركات على متابعة مؤشرات الأداء الرئيسية وفهم أداء المبيعات