Superstore Sales Analysis & Business Insights
تفاصيل العمل
Project Overview
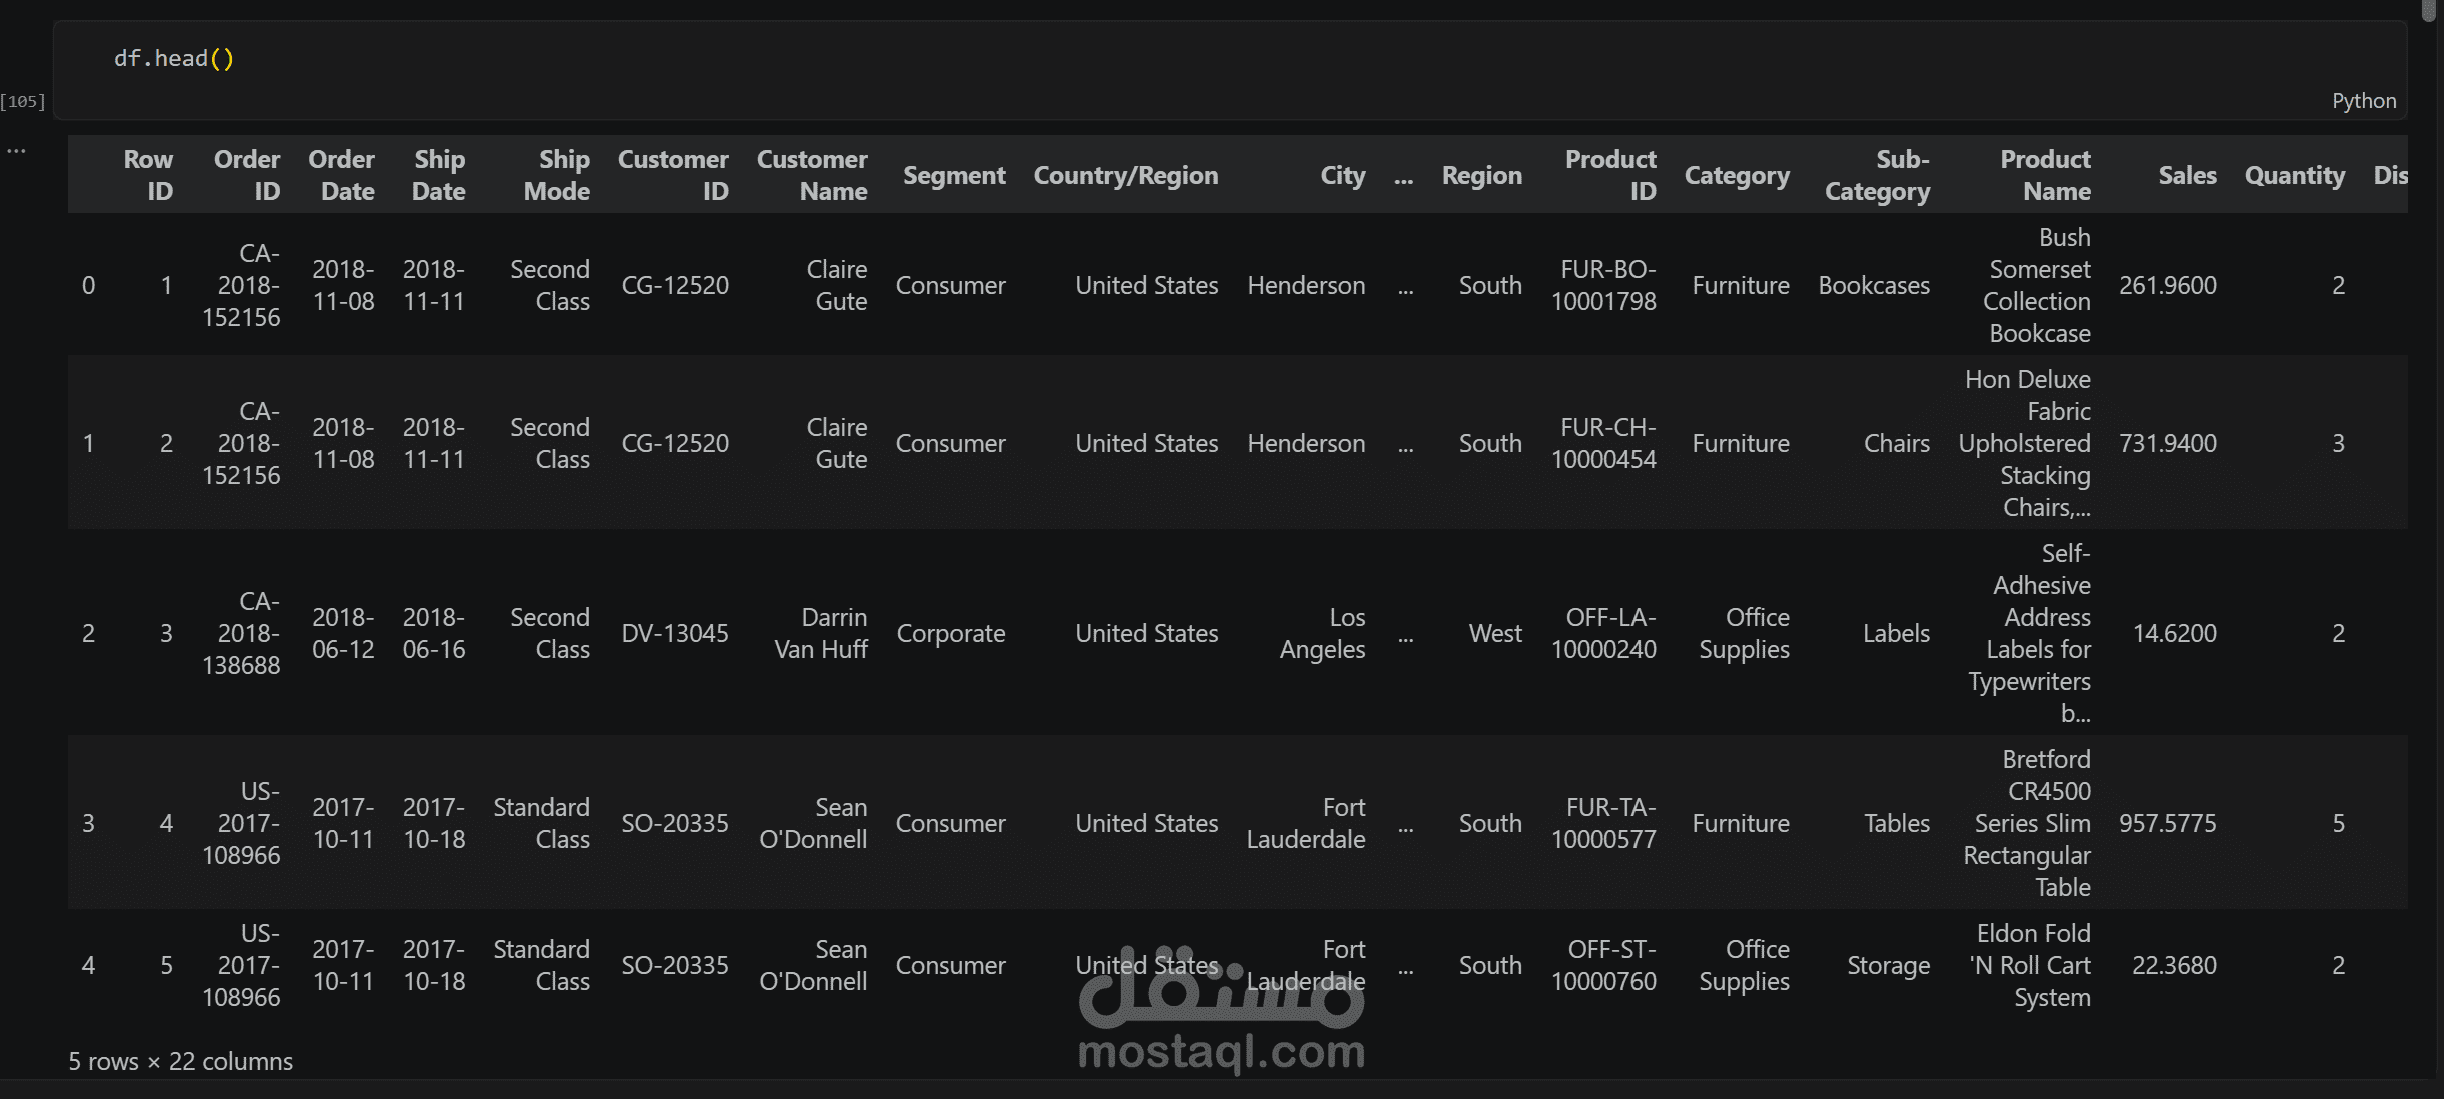
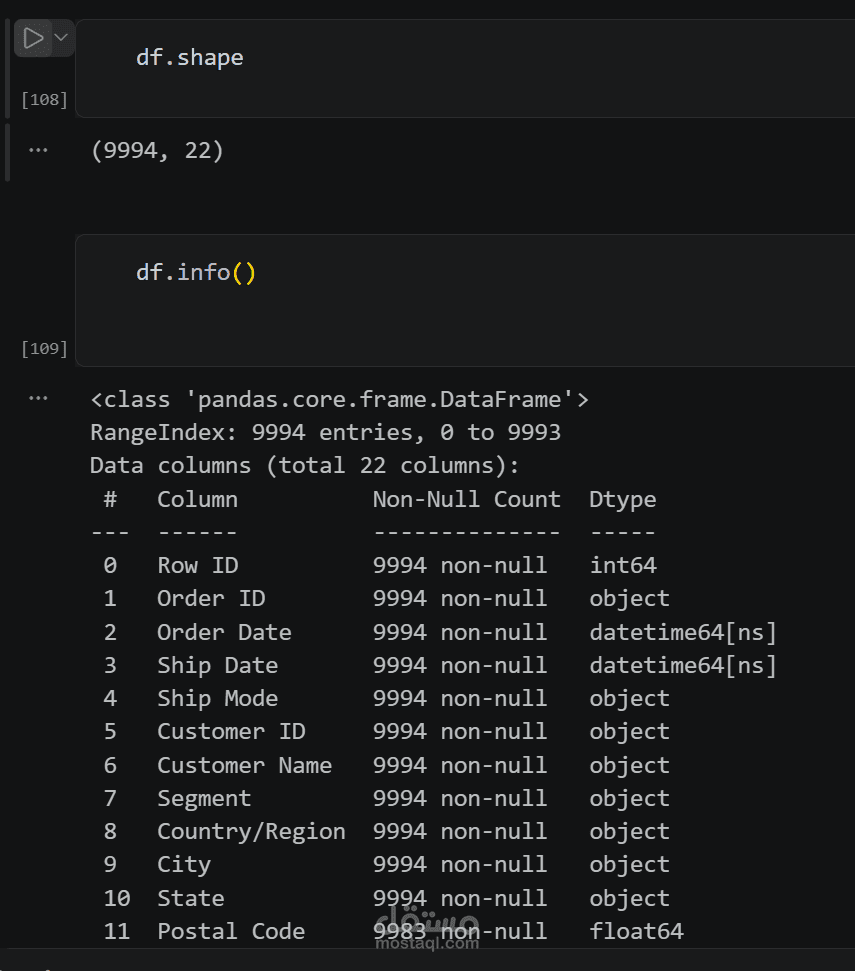
Analyzed a Superstore sales dataset using Python, Pandas, Matplotlib, and Seaborn to identify sales patterns, profitability drivers, discount impact, and business opportunities.
Key Performance Indicators
Calculated key business metrics including:
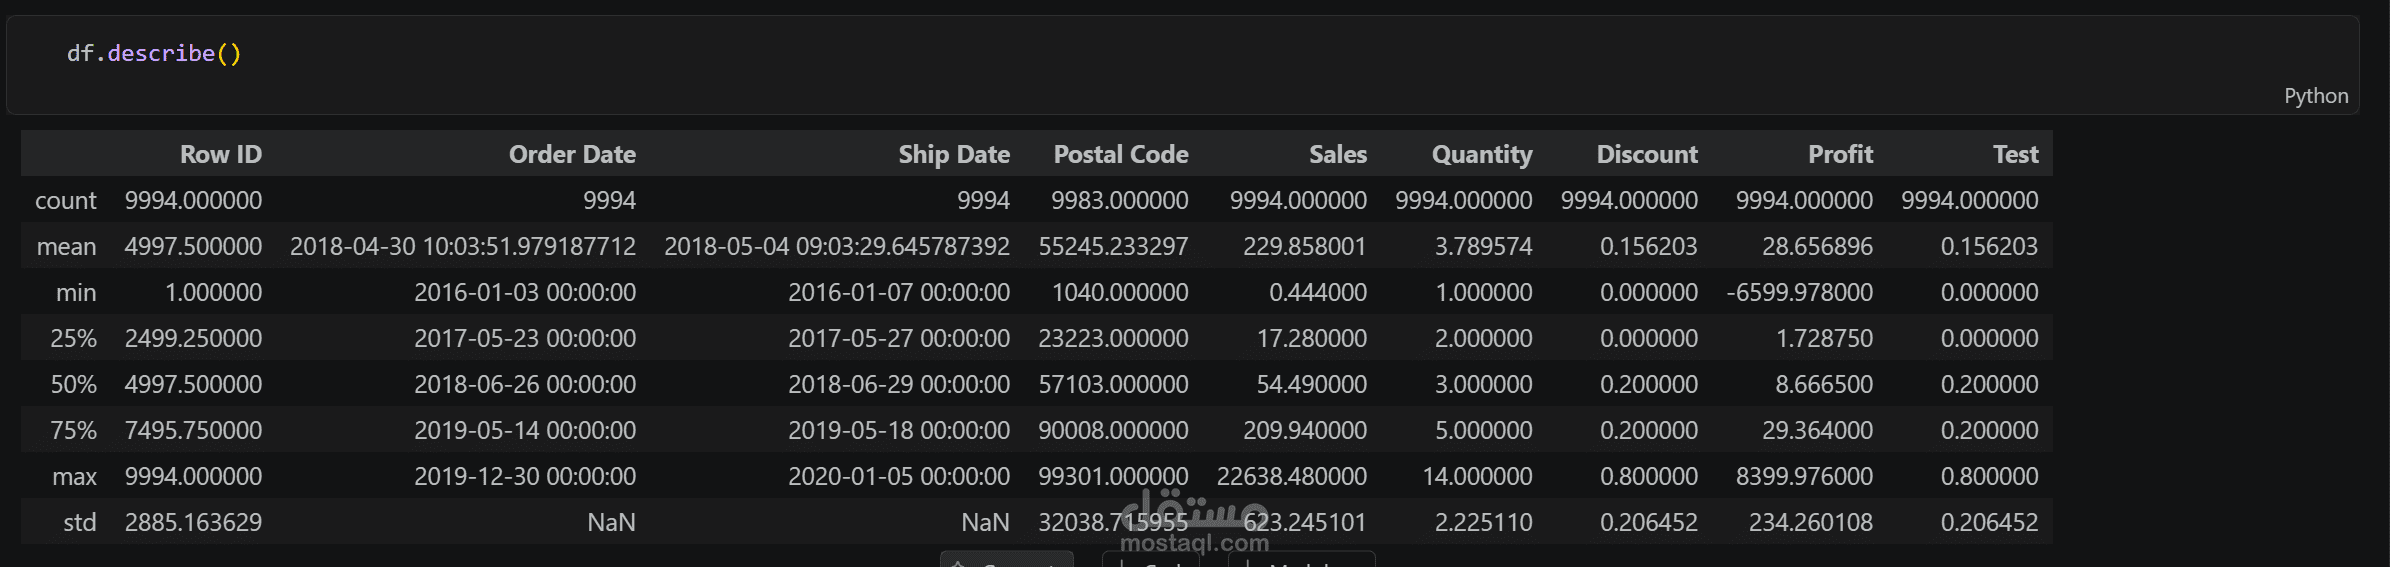
Total Sales: 2,297,200.75
Total Profit: 286,397.03
Average Sales: 229.86
Average Profit: 28.66
Total Quantity: 37,873
Business Analysis
Analyzed:
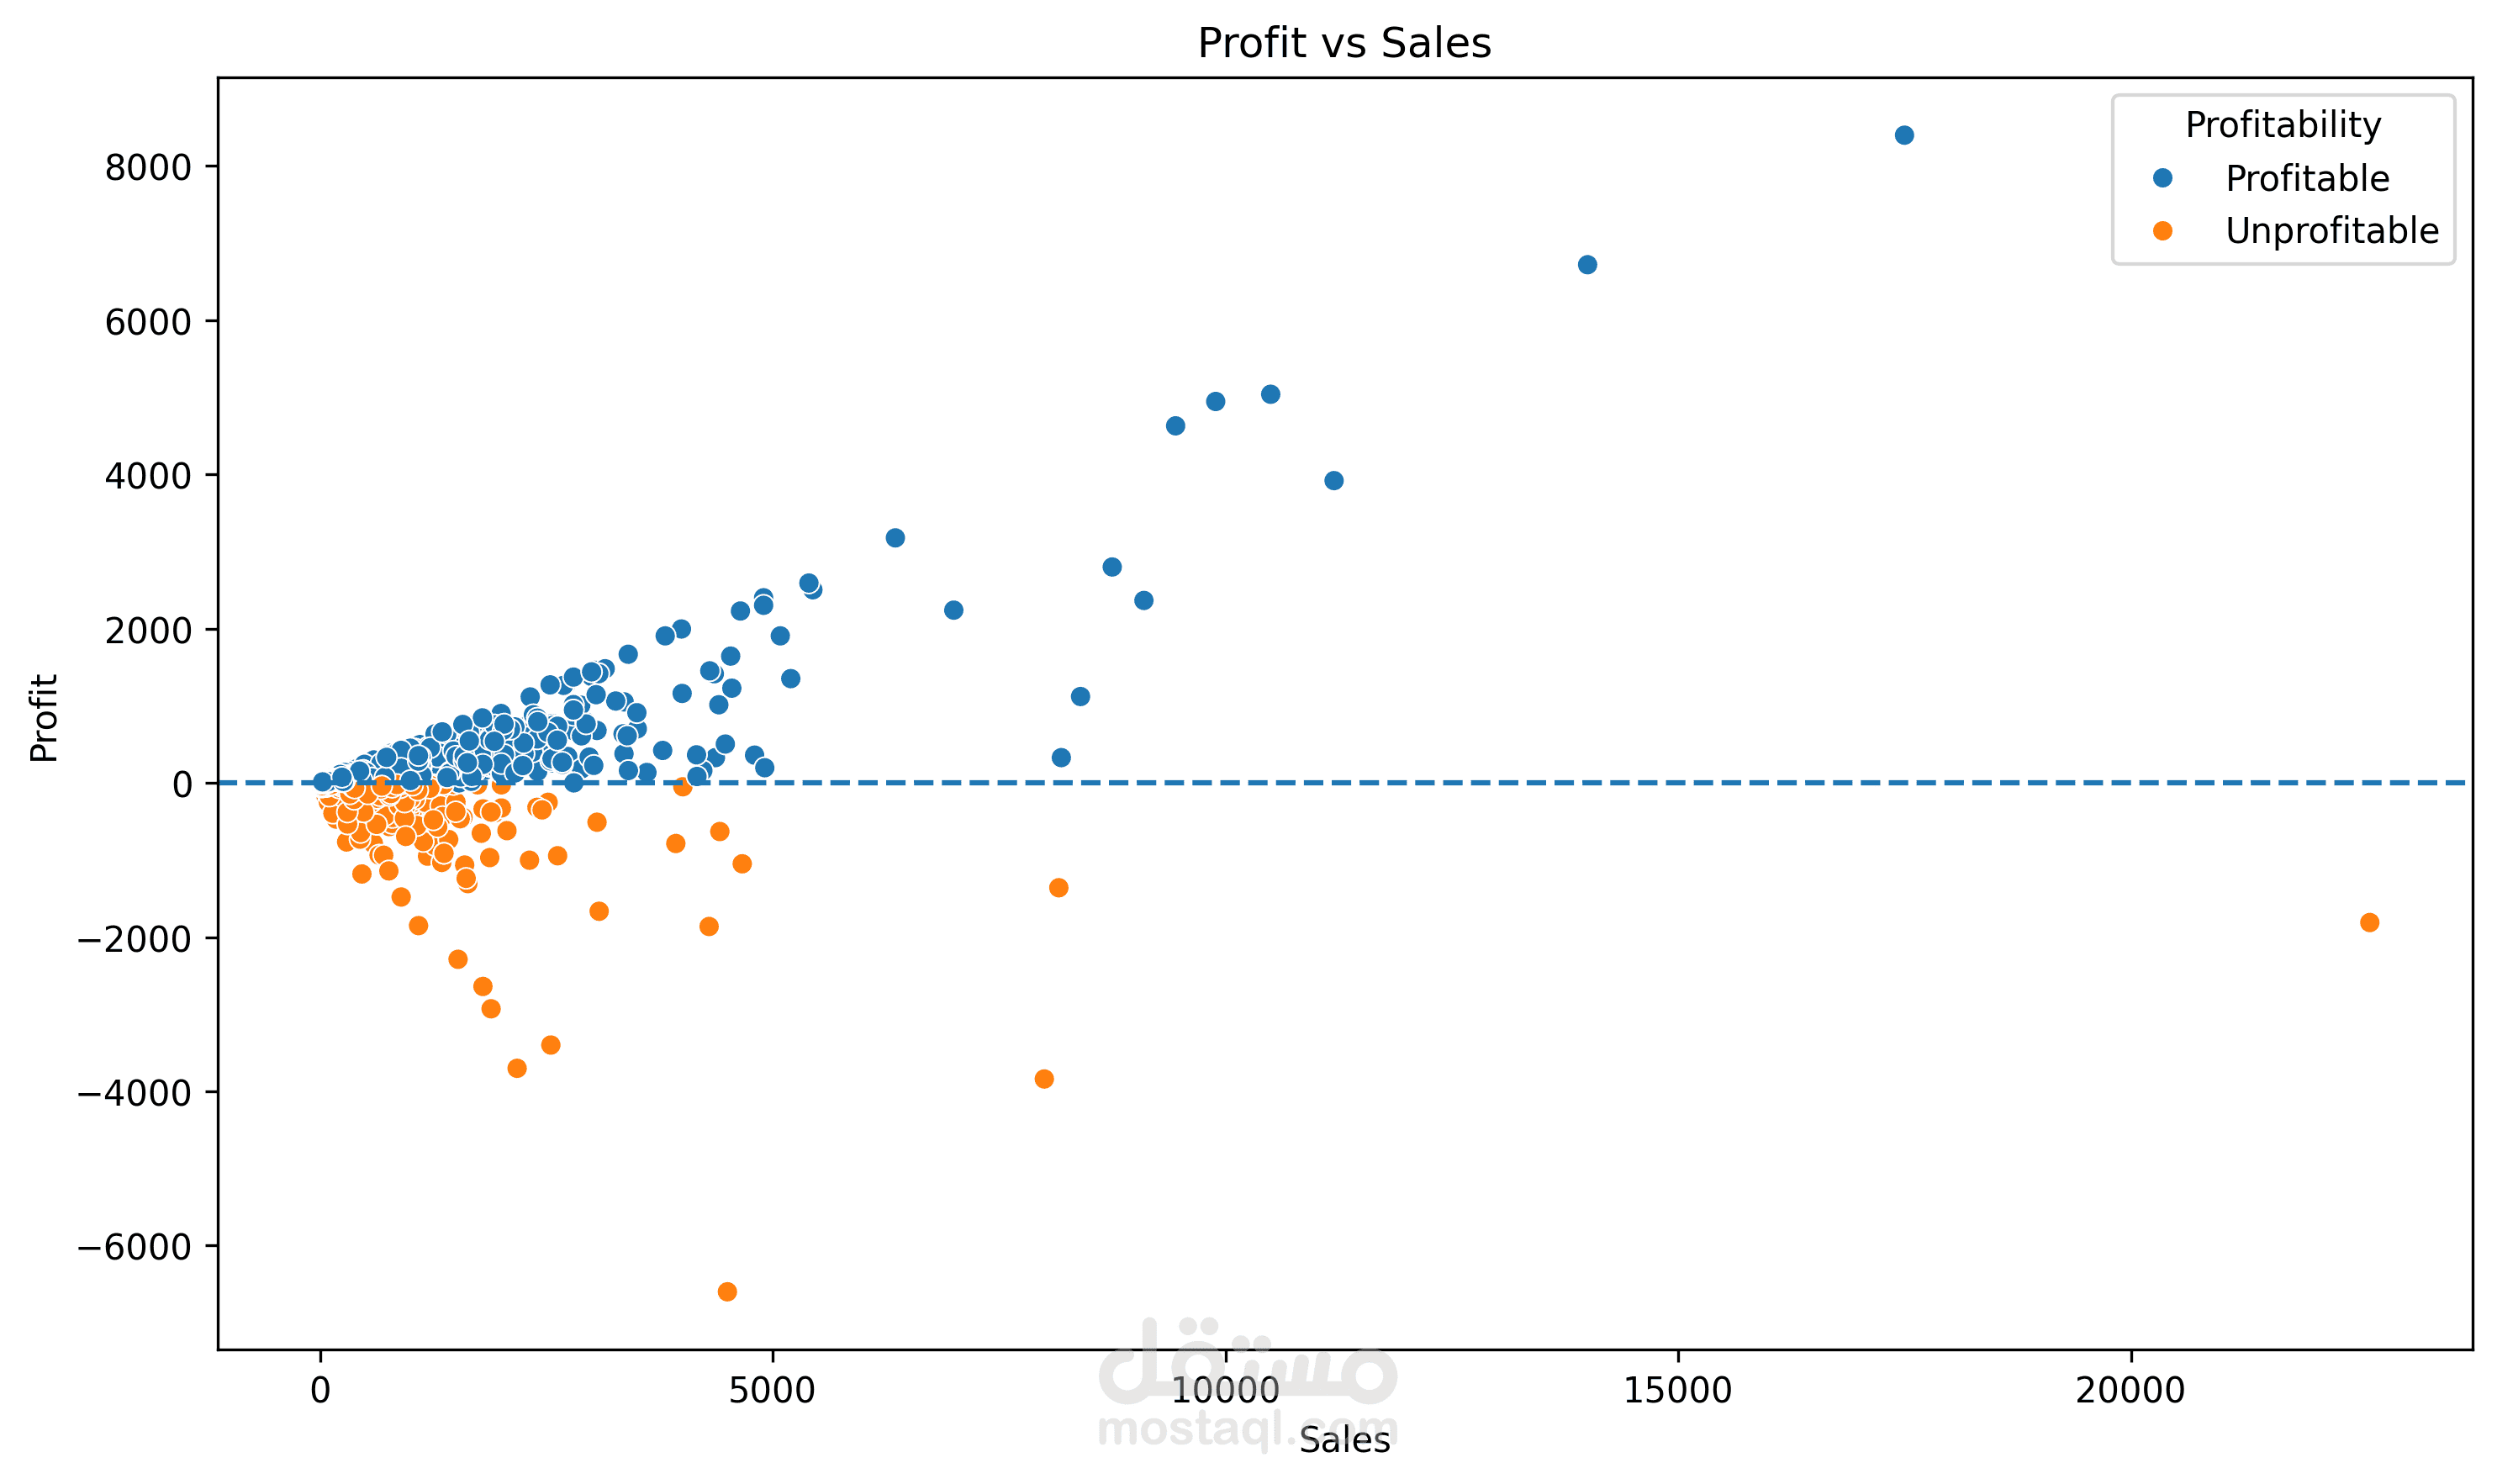
Loss-making products and high-sales low-profit transactions
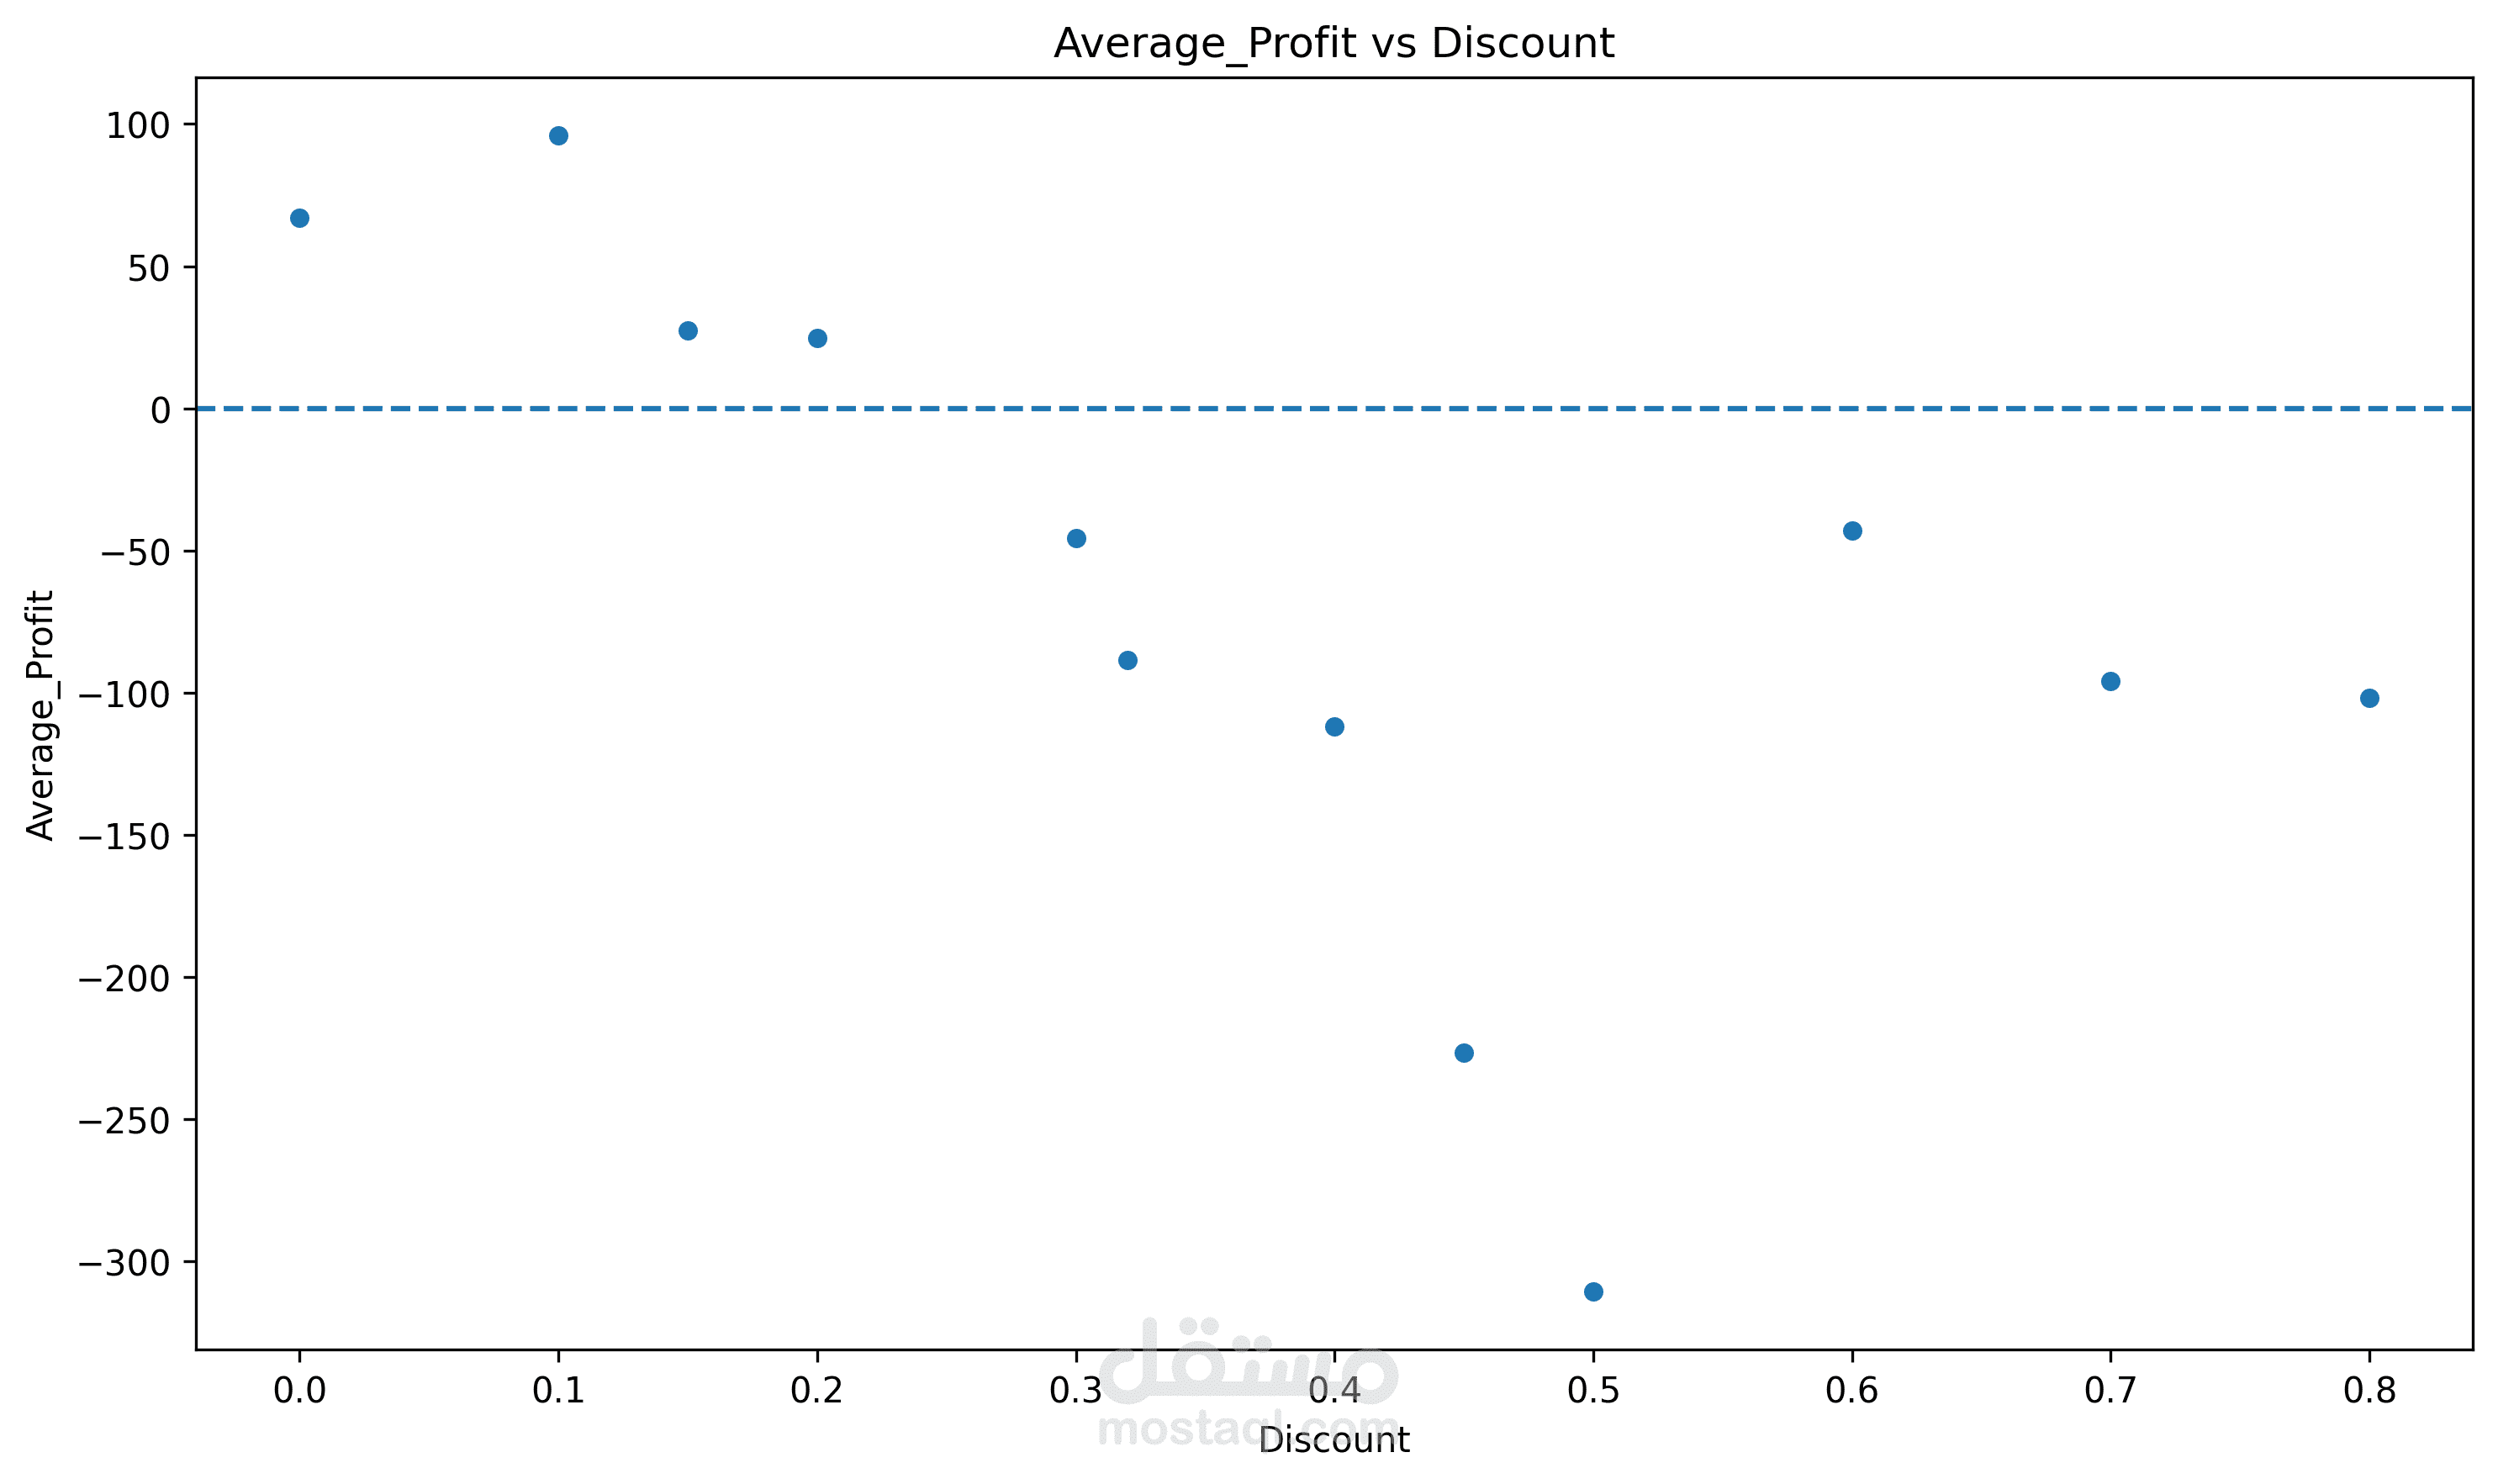
The impact of discounts on profitability
Sales and profit relationships
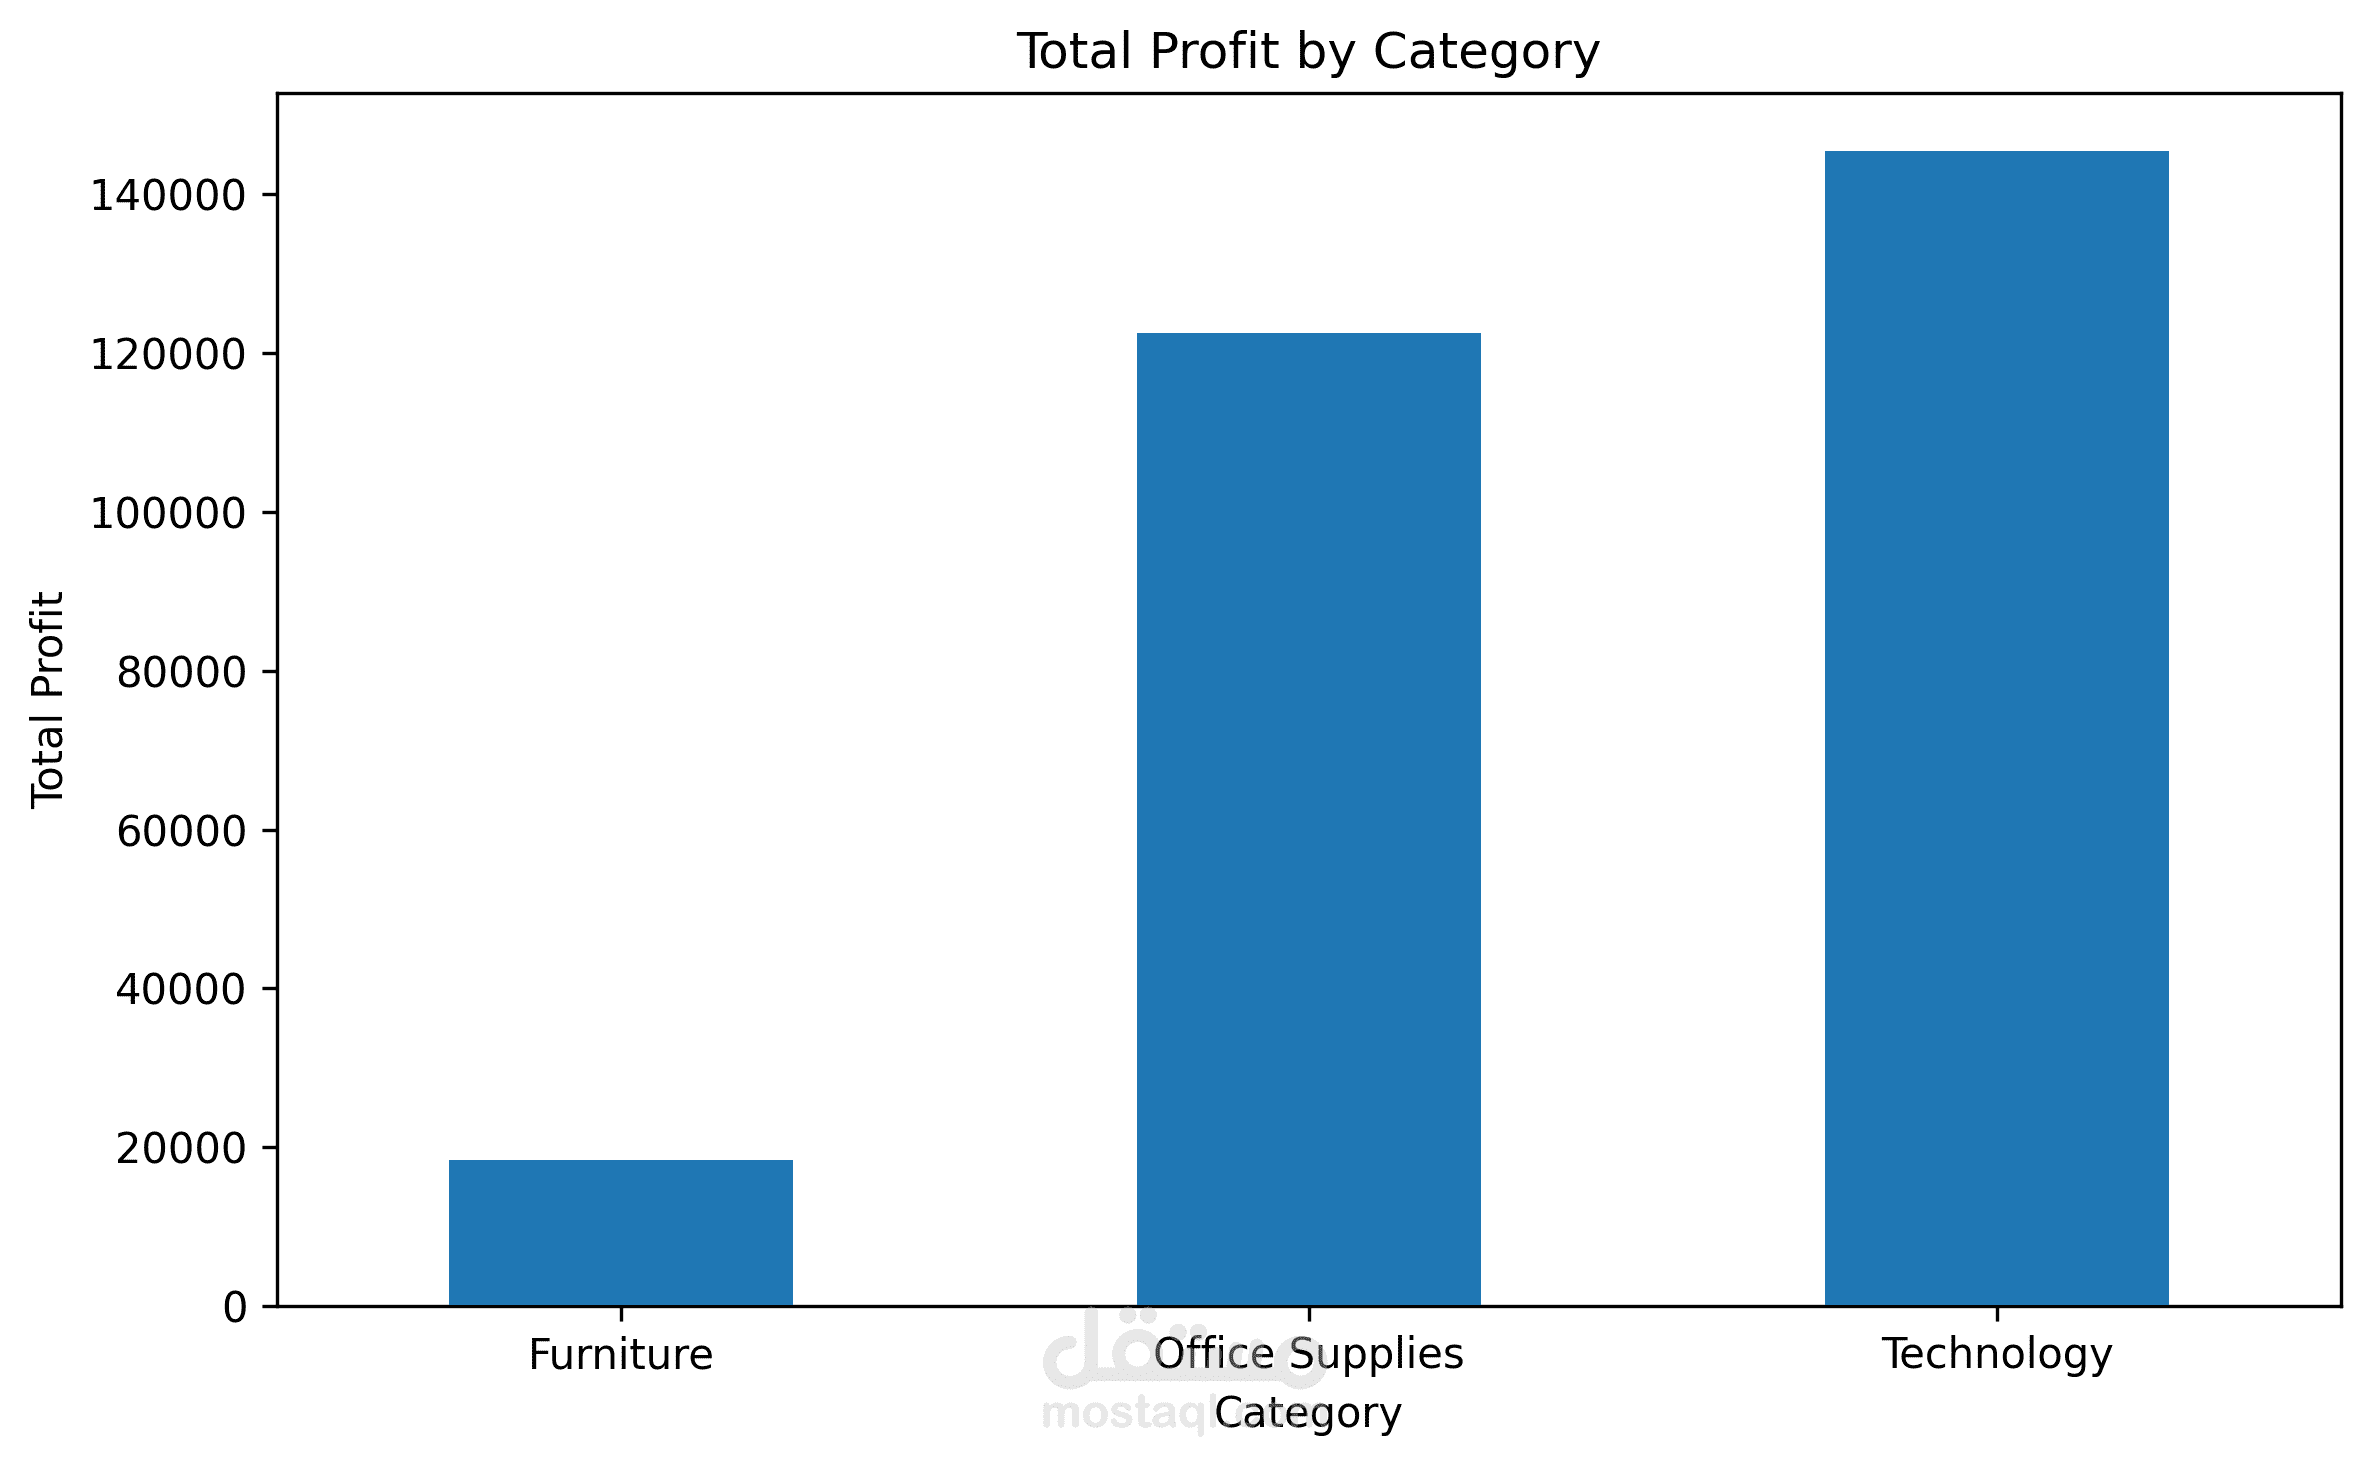
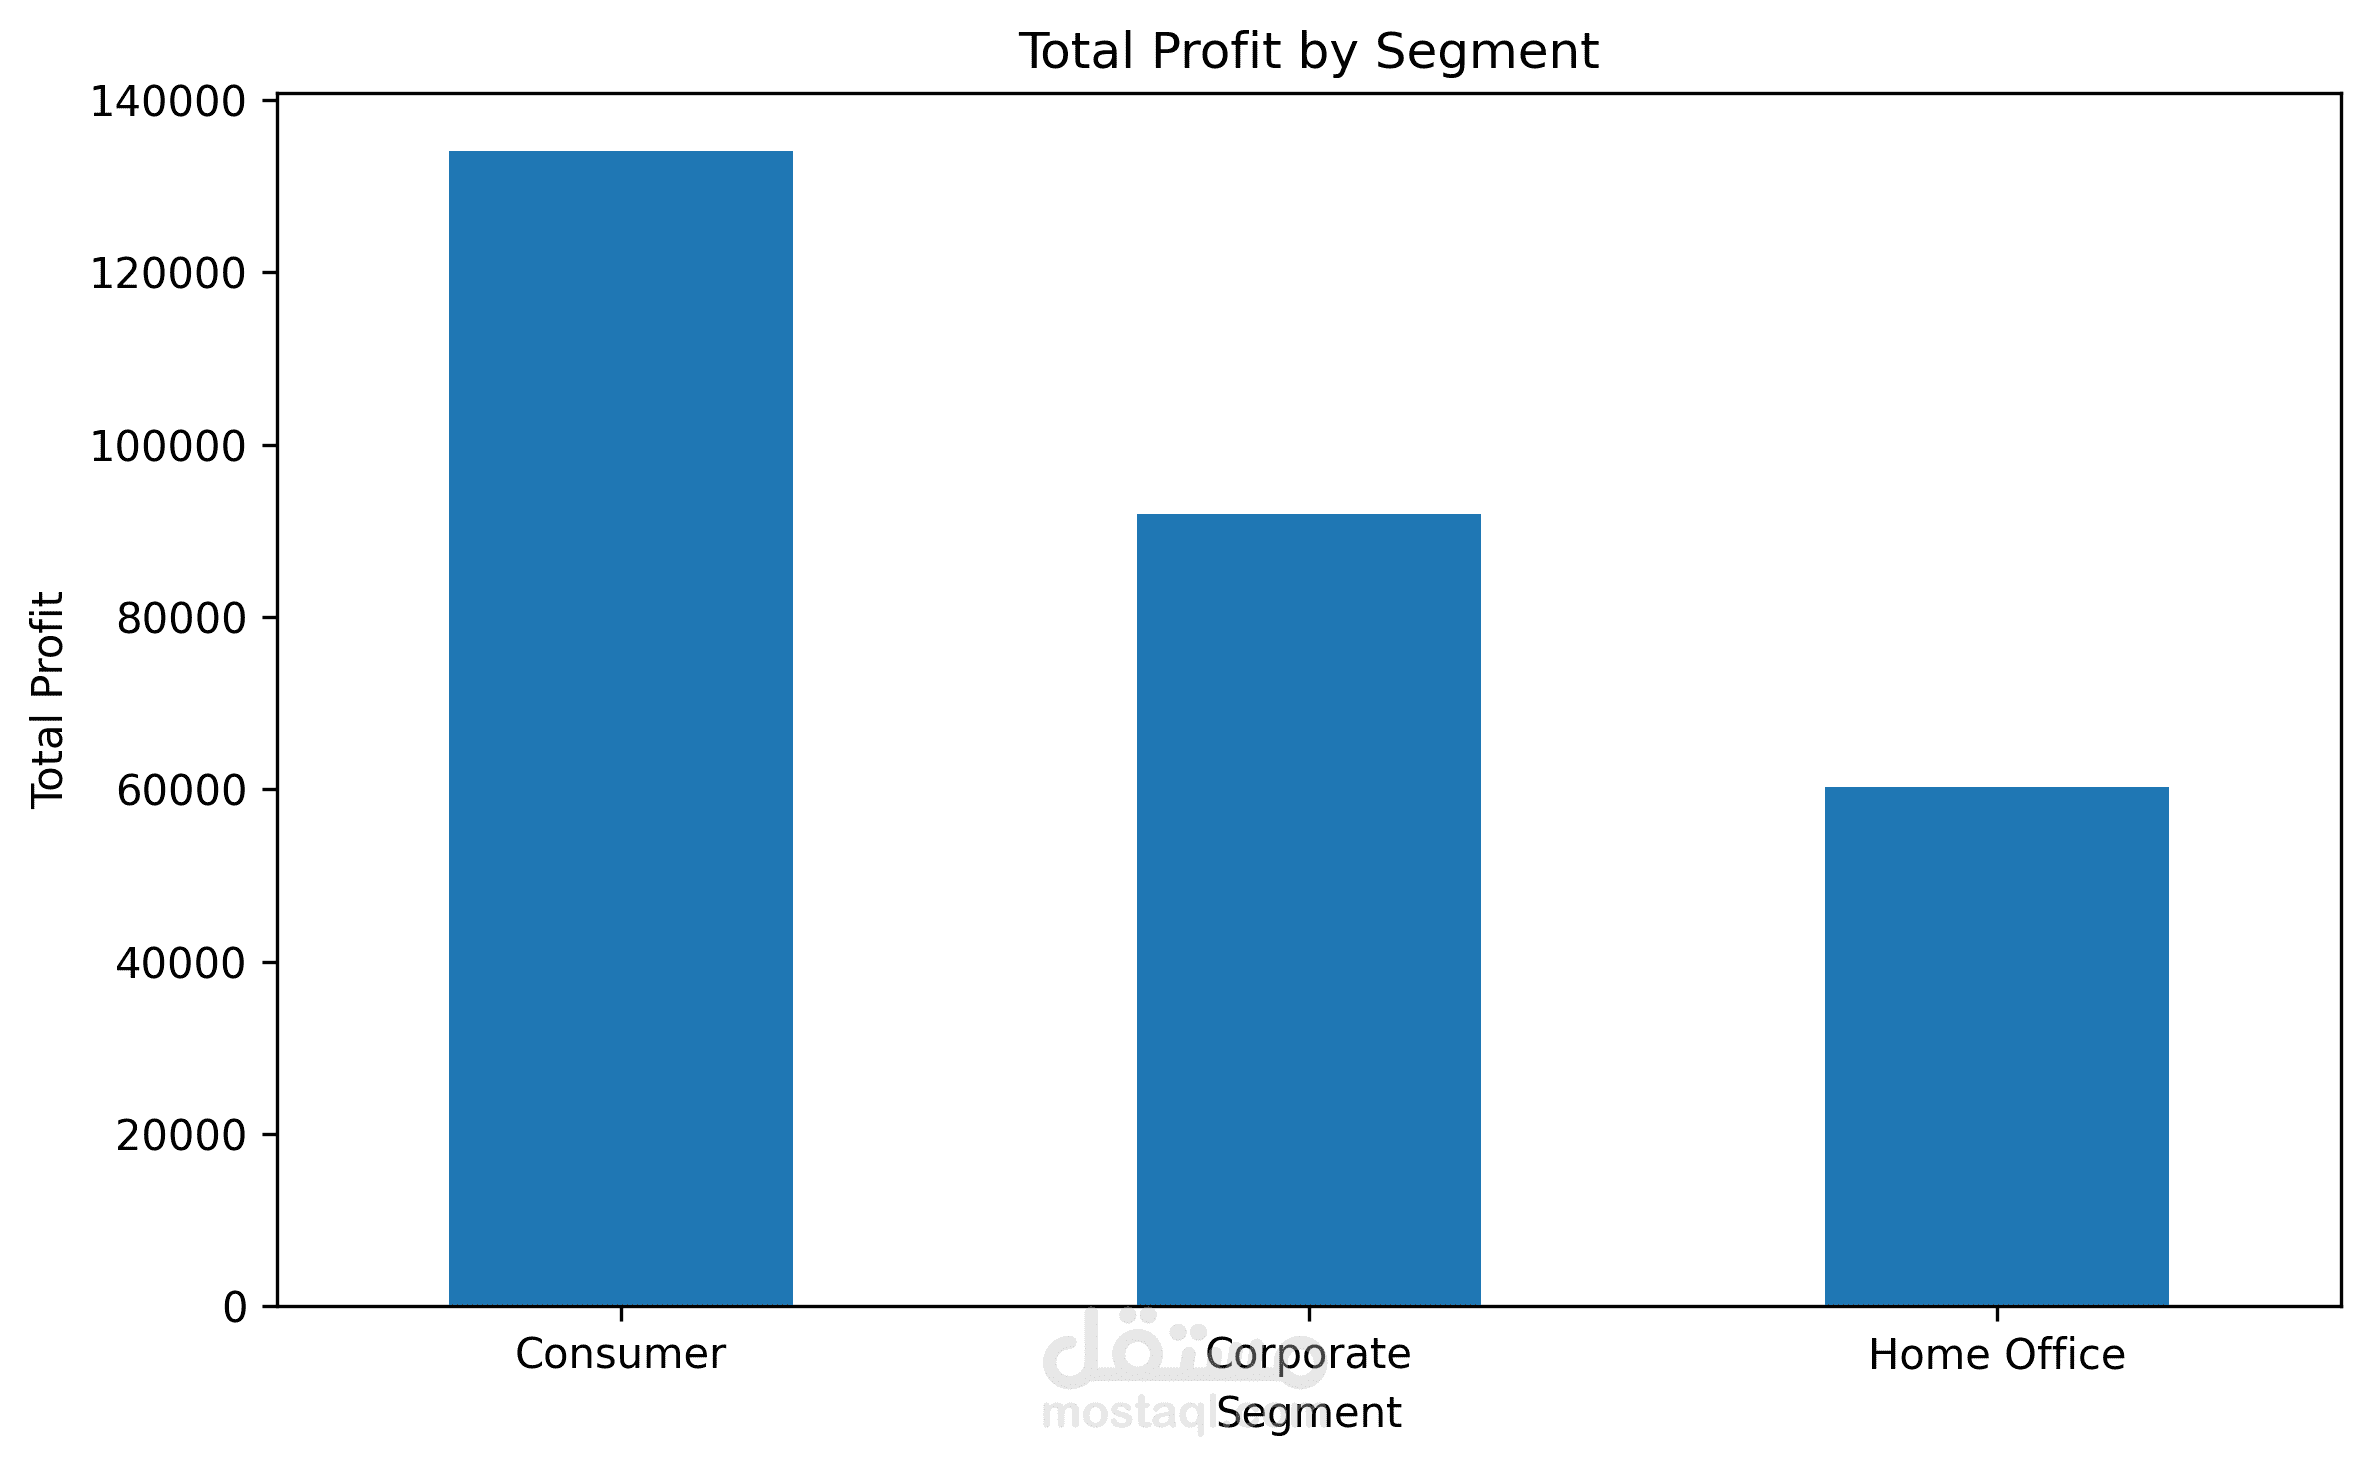
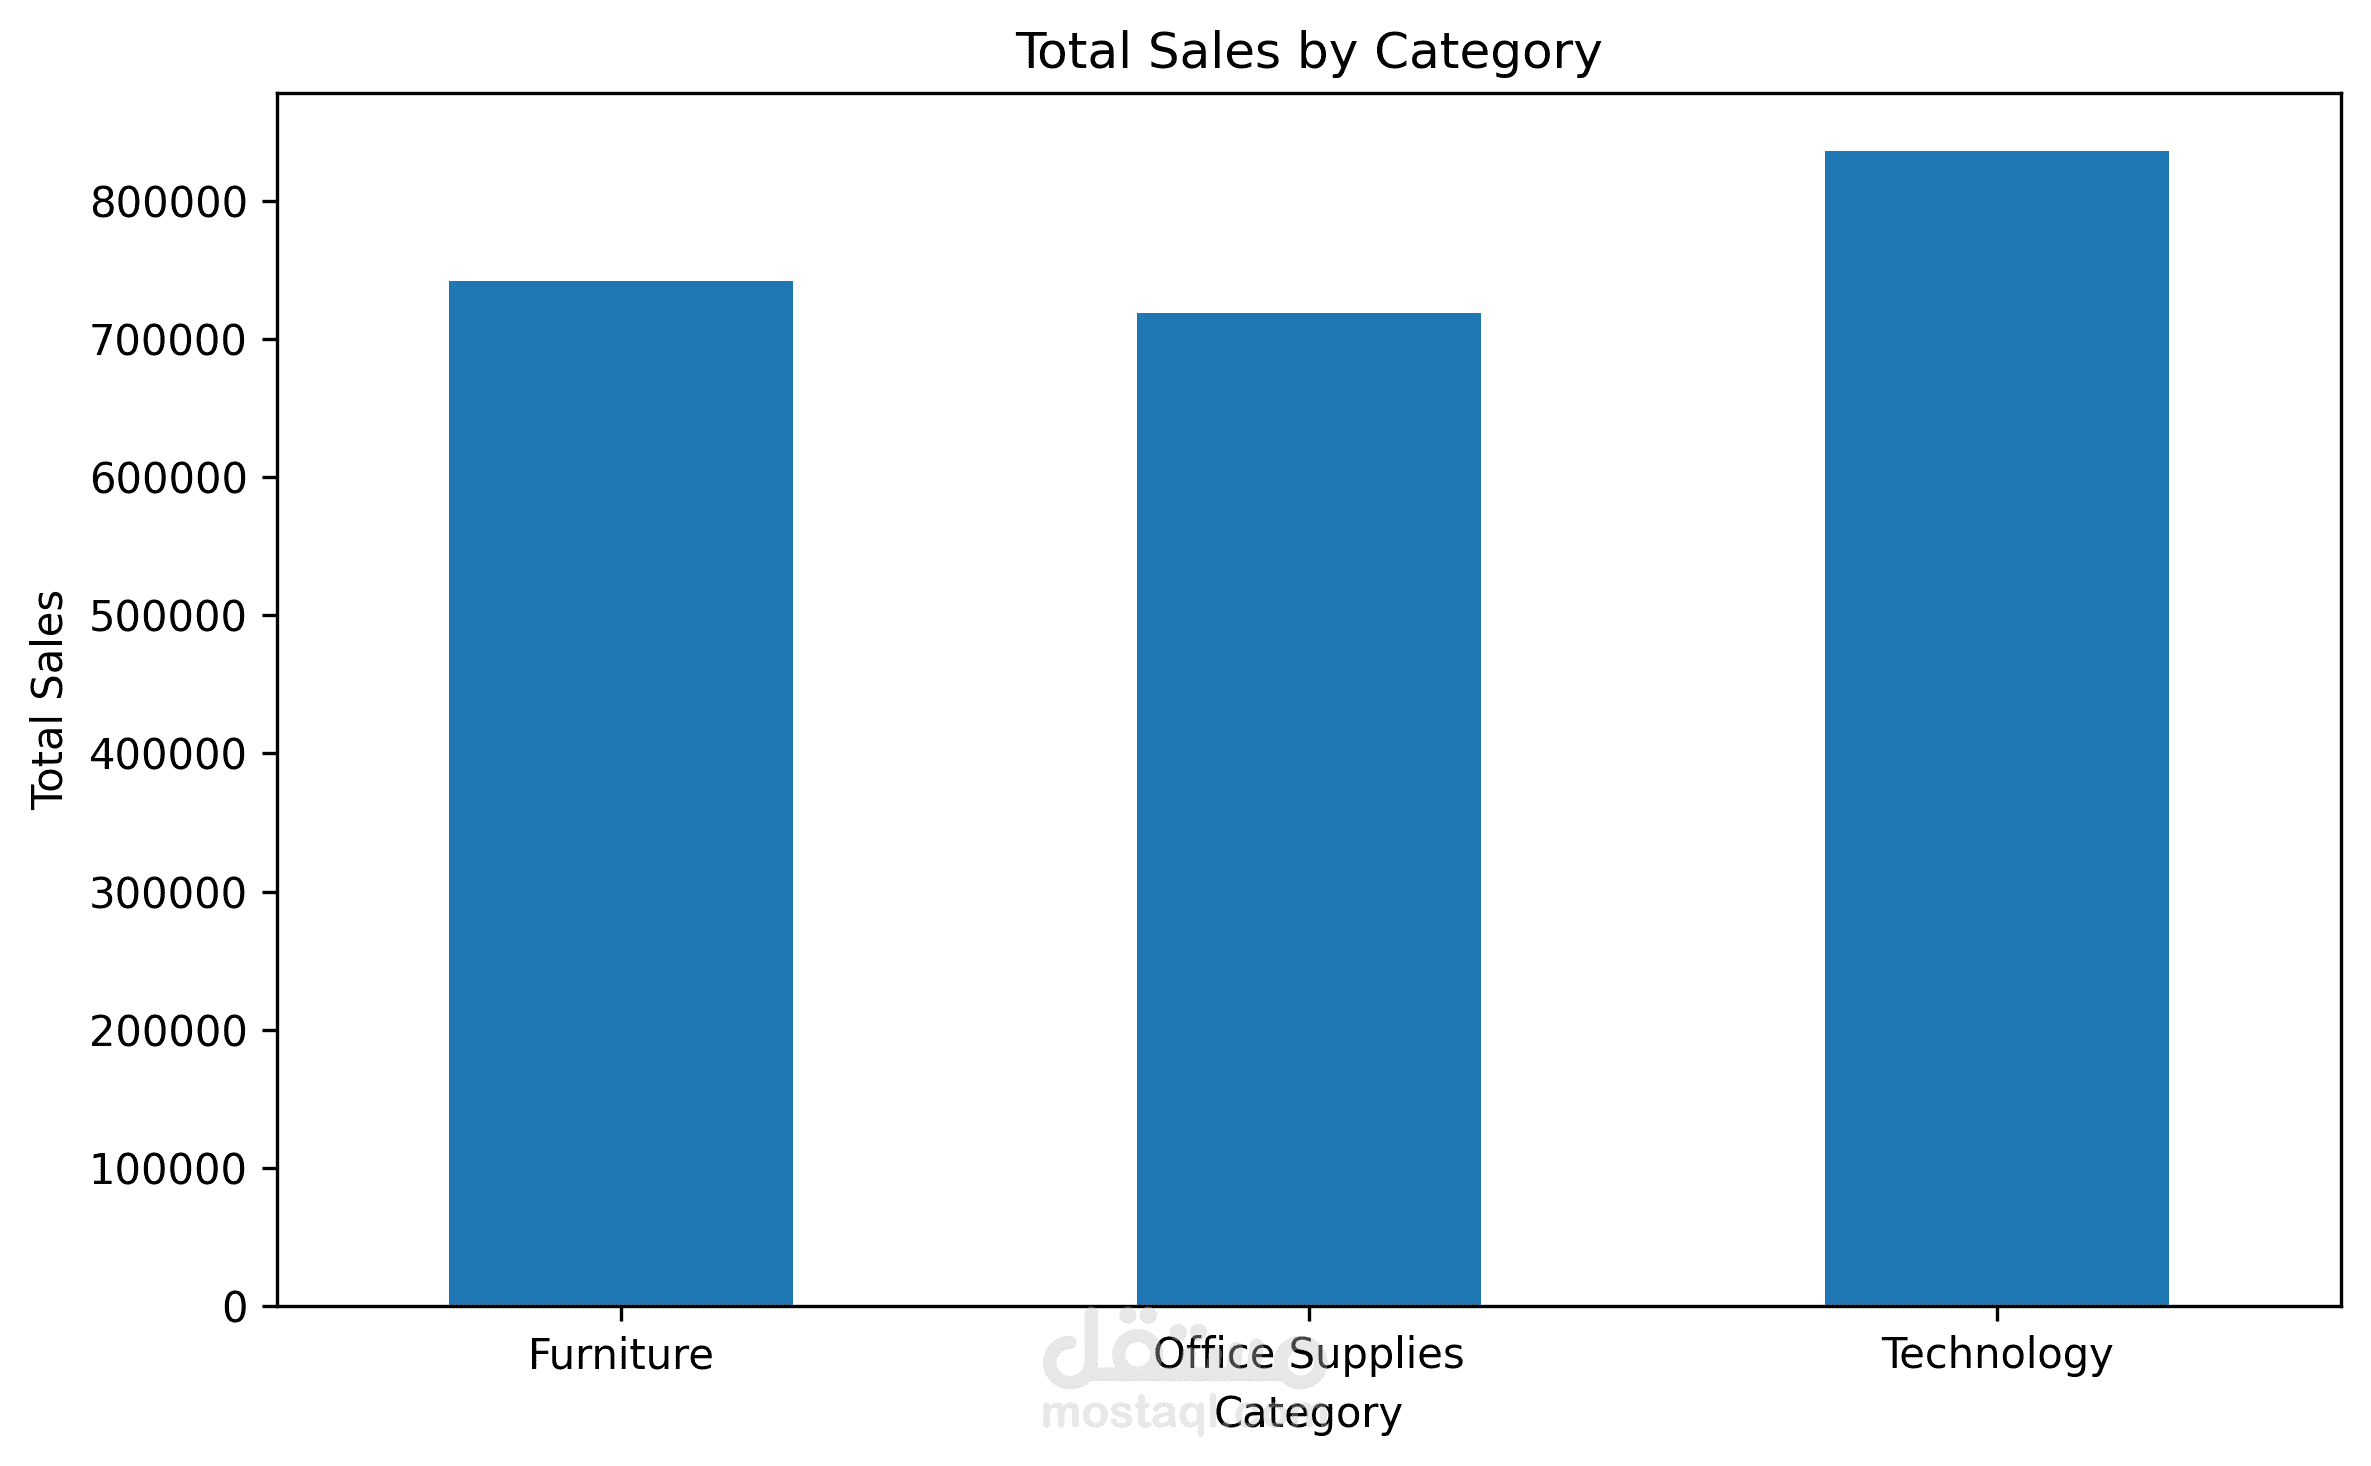
Category and customer segment performance
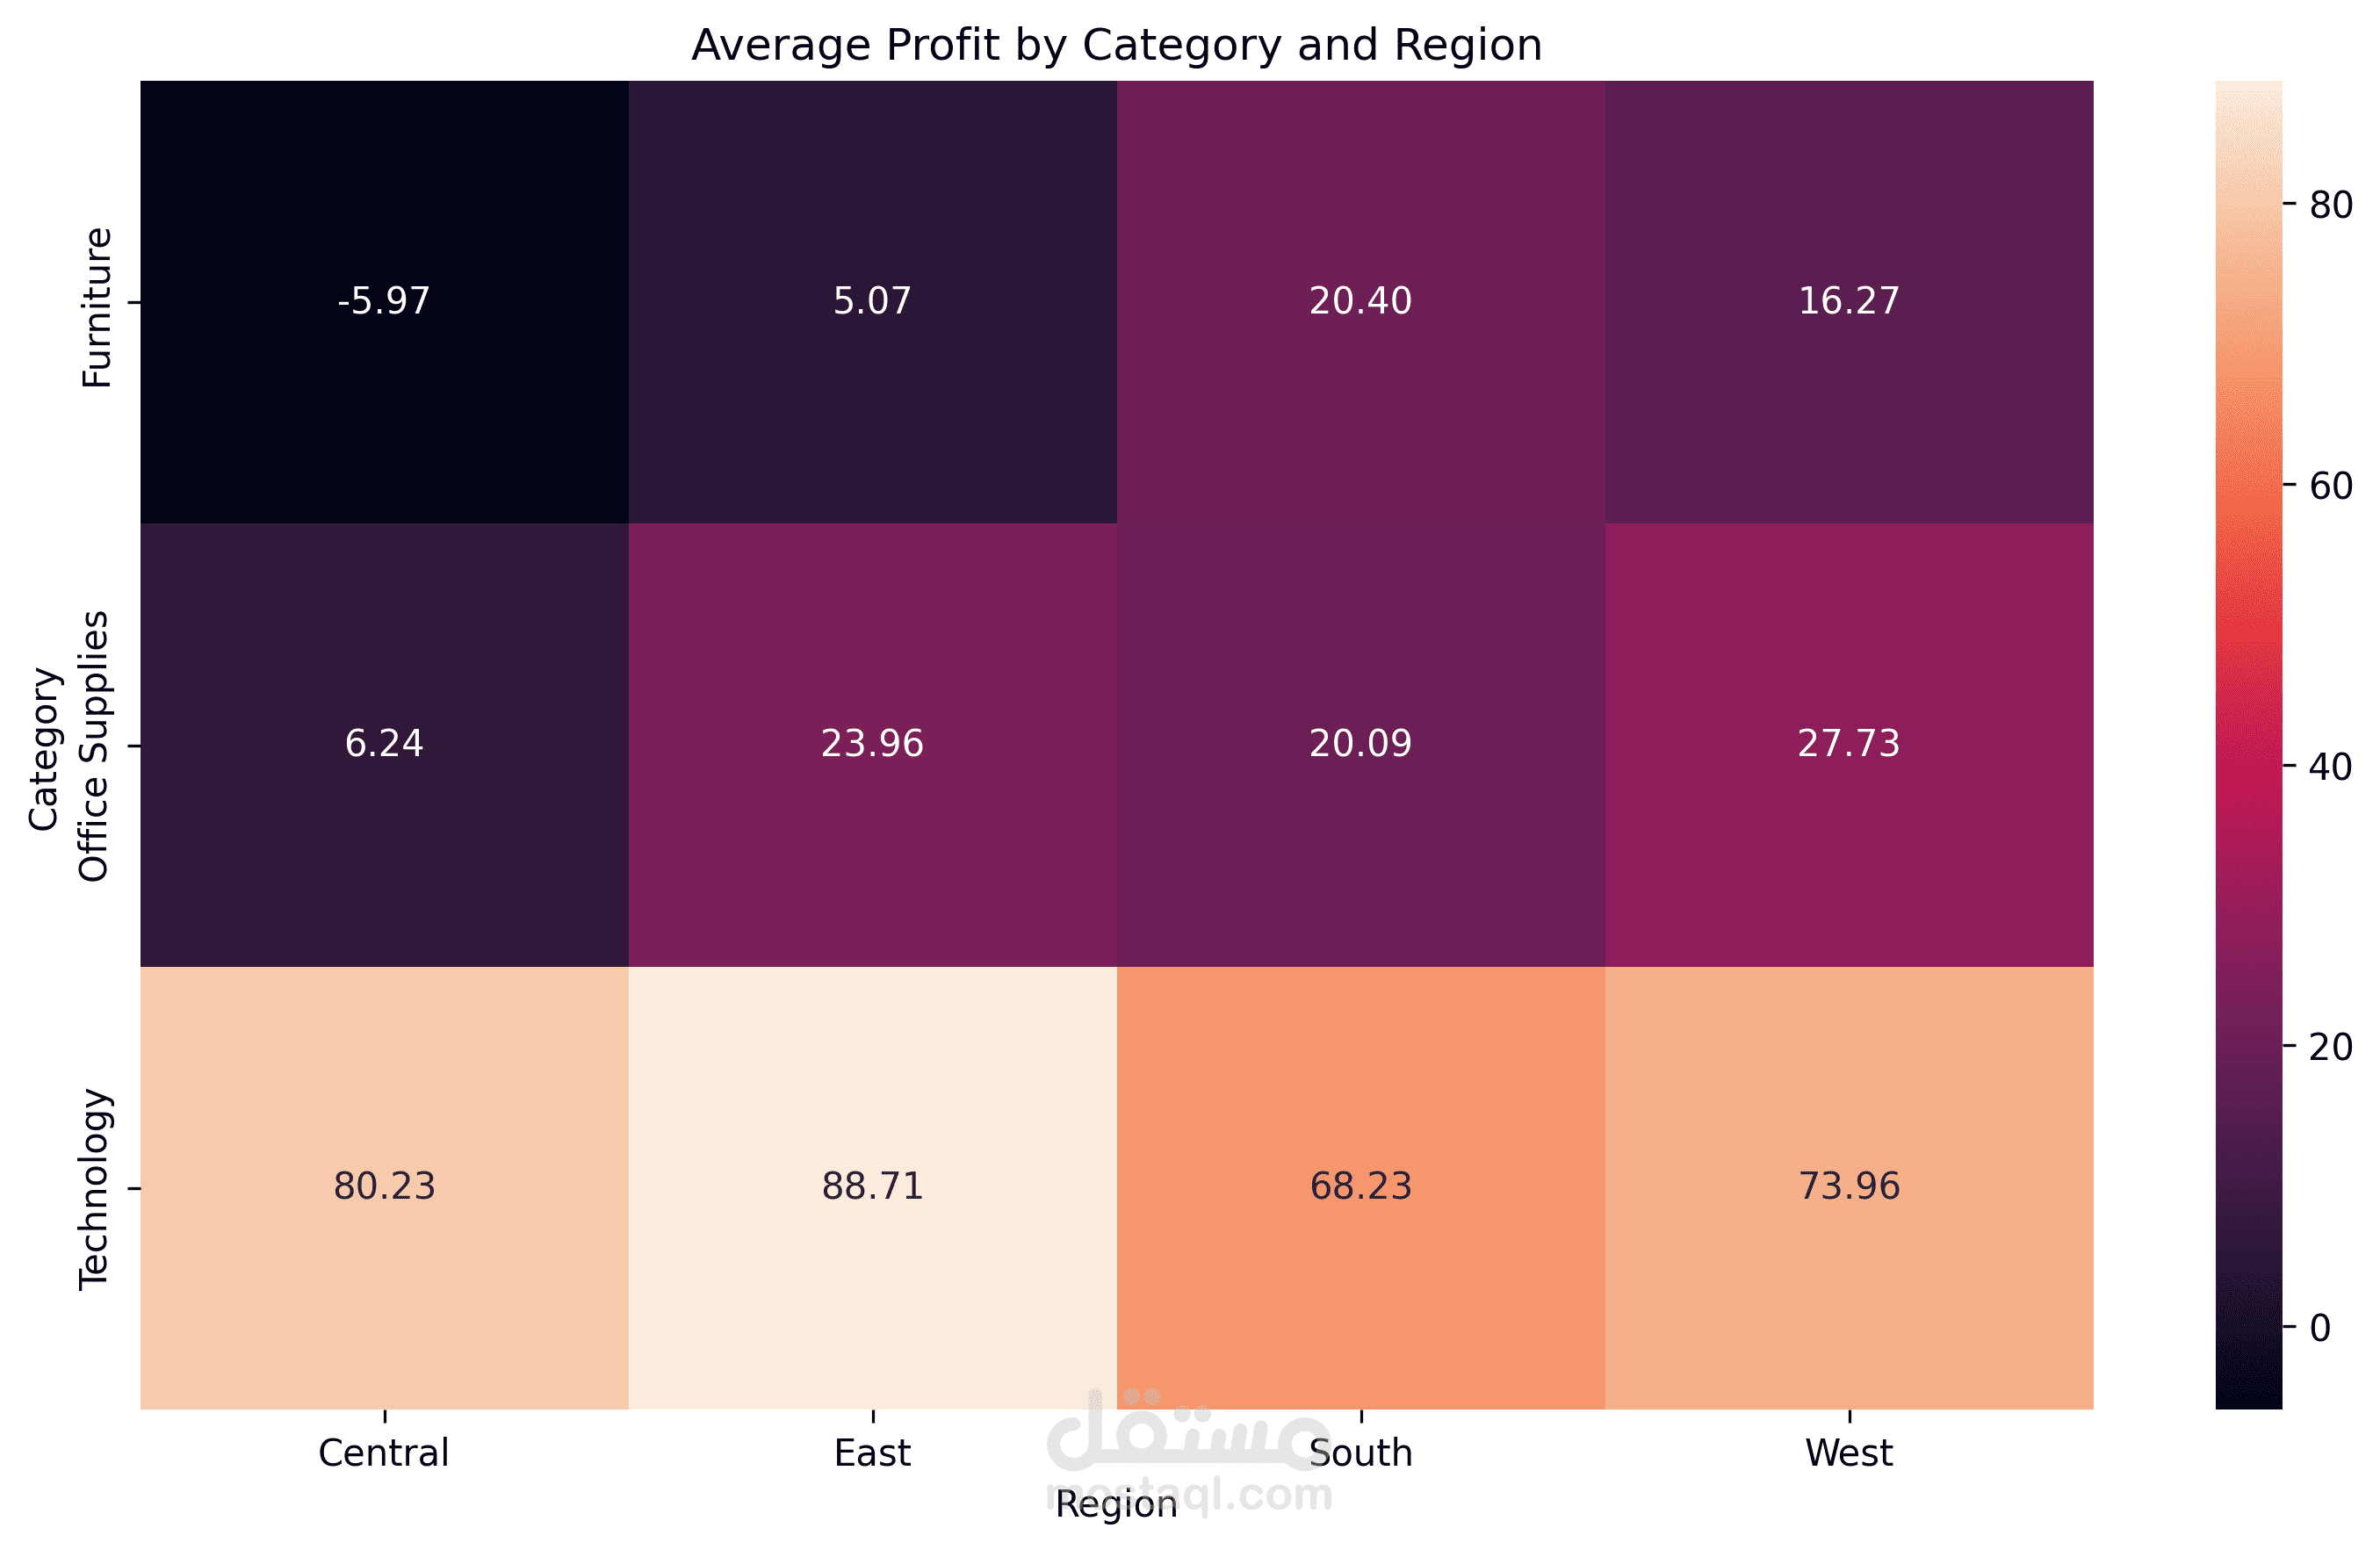
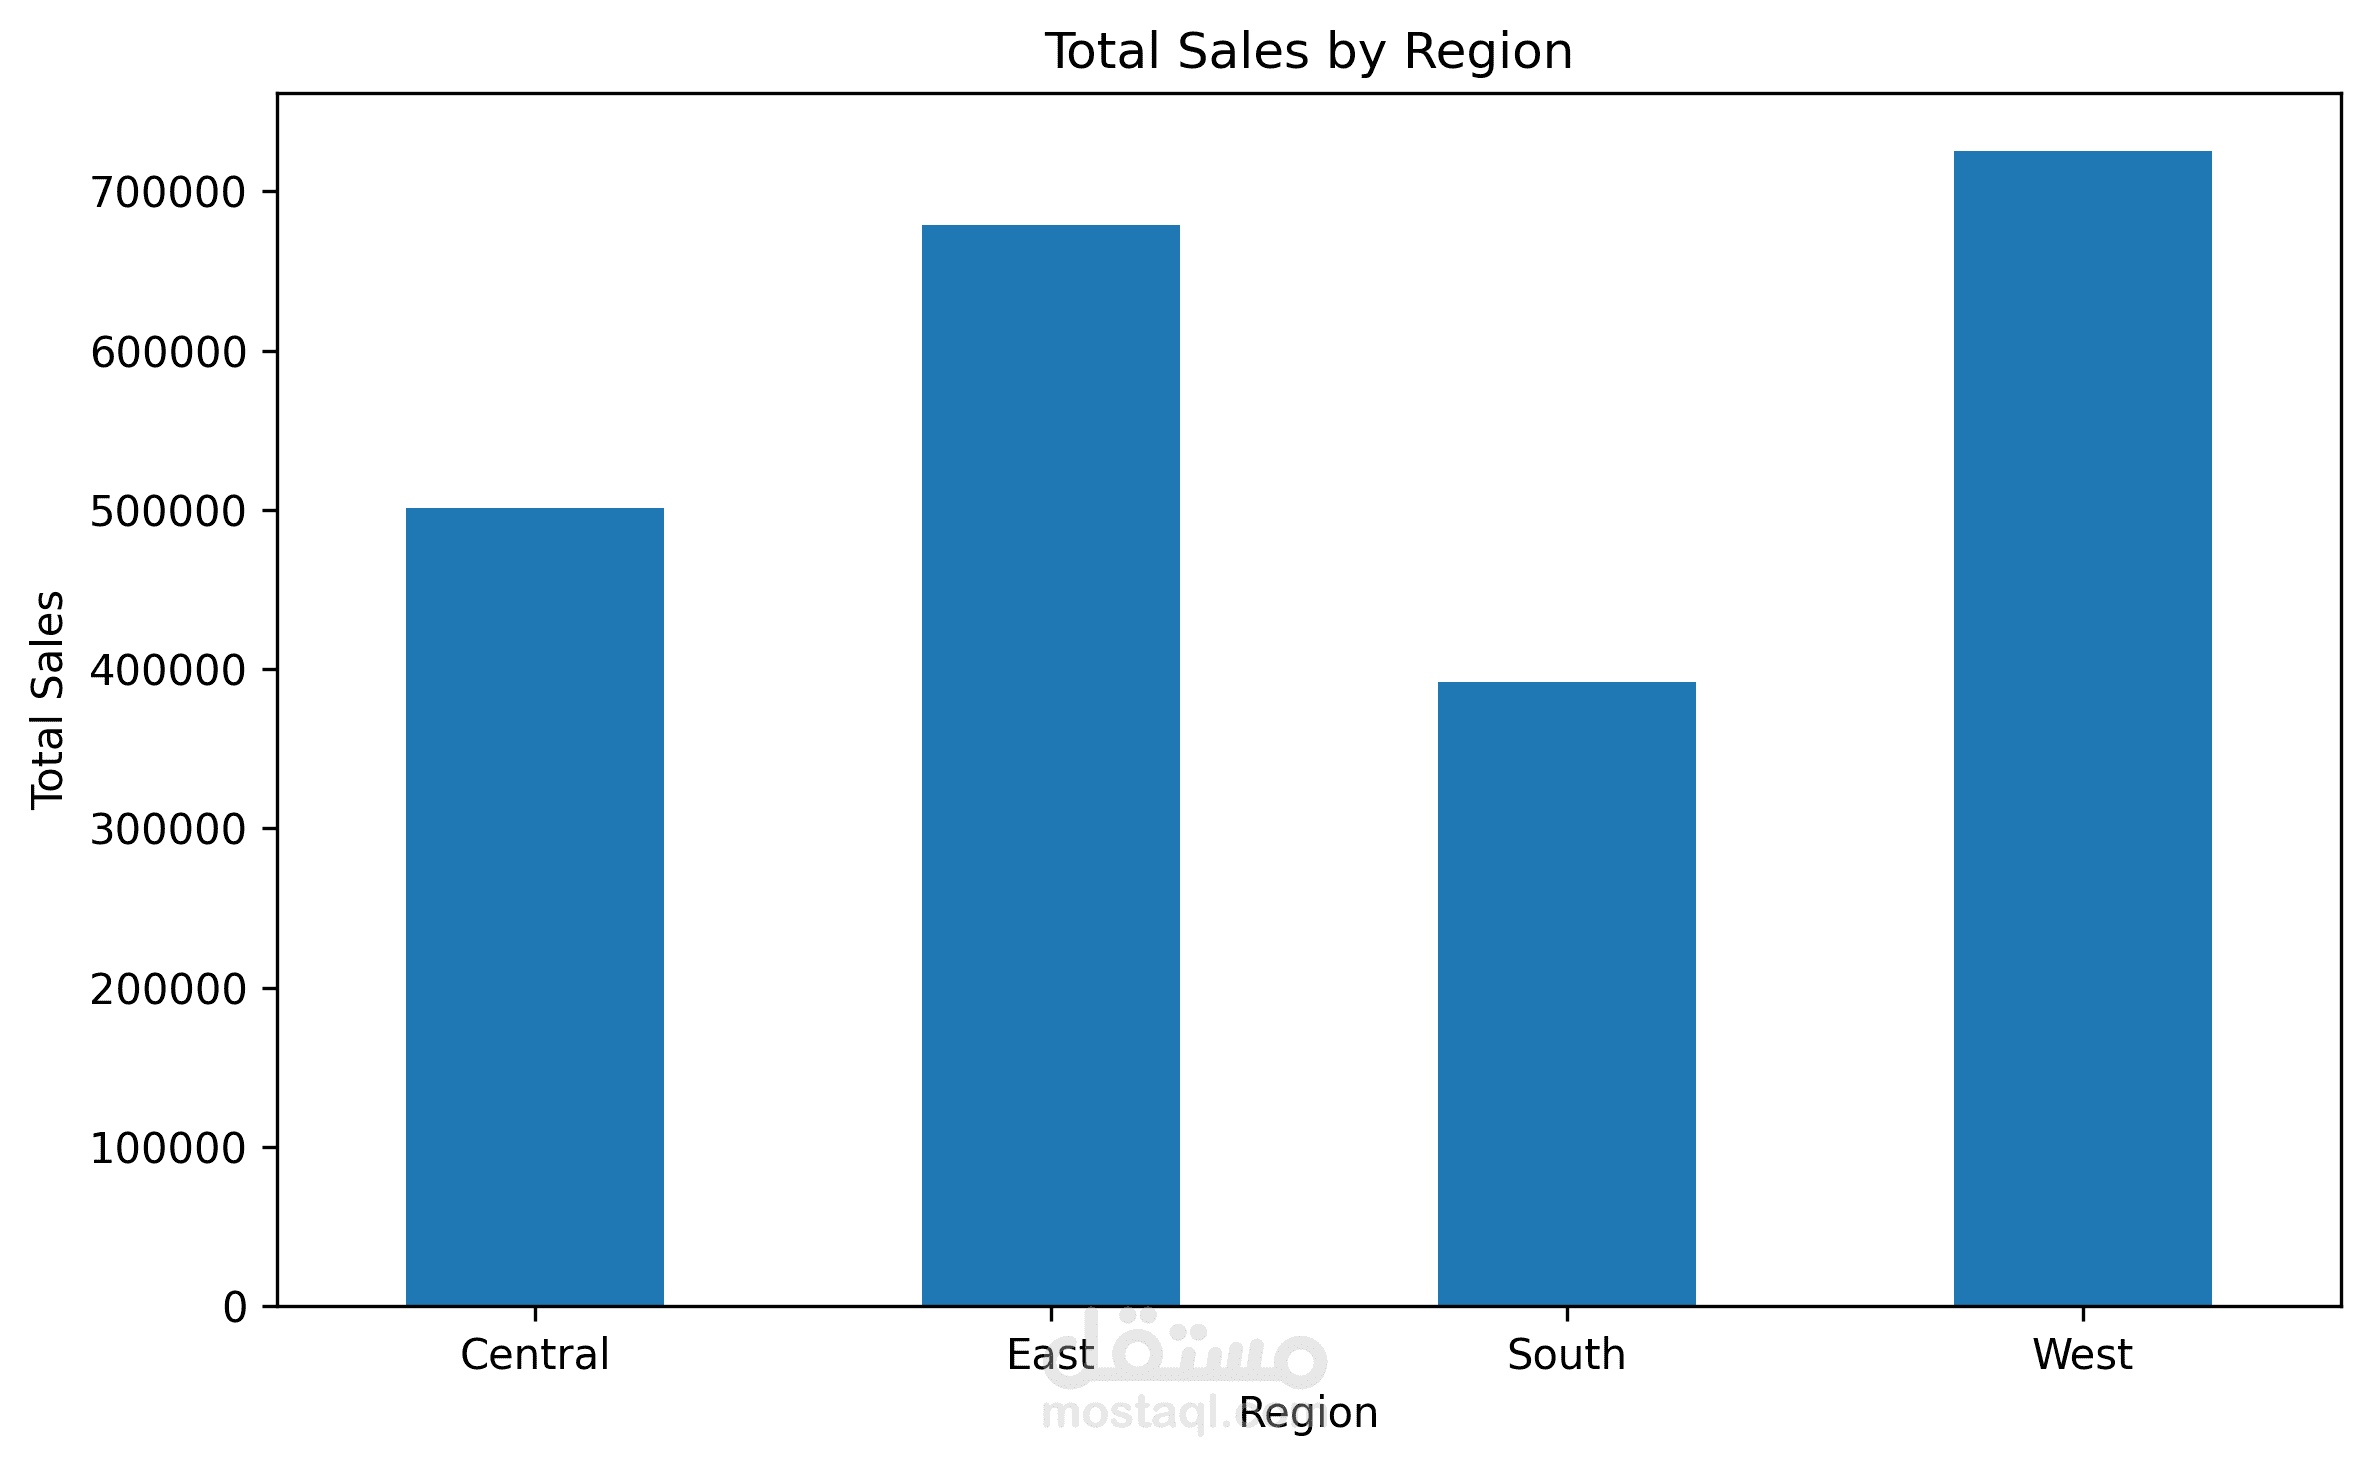
Category and region profitability
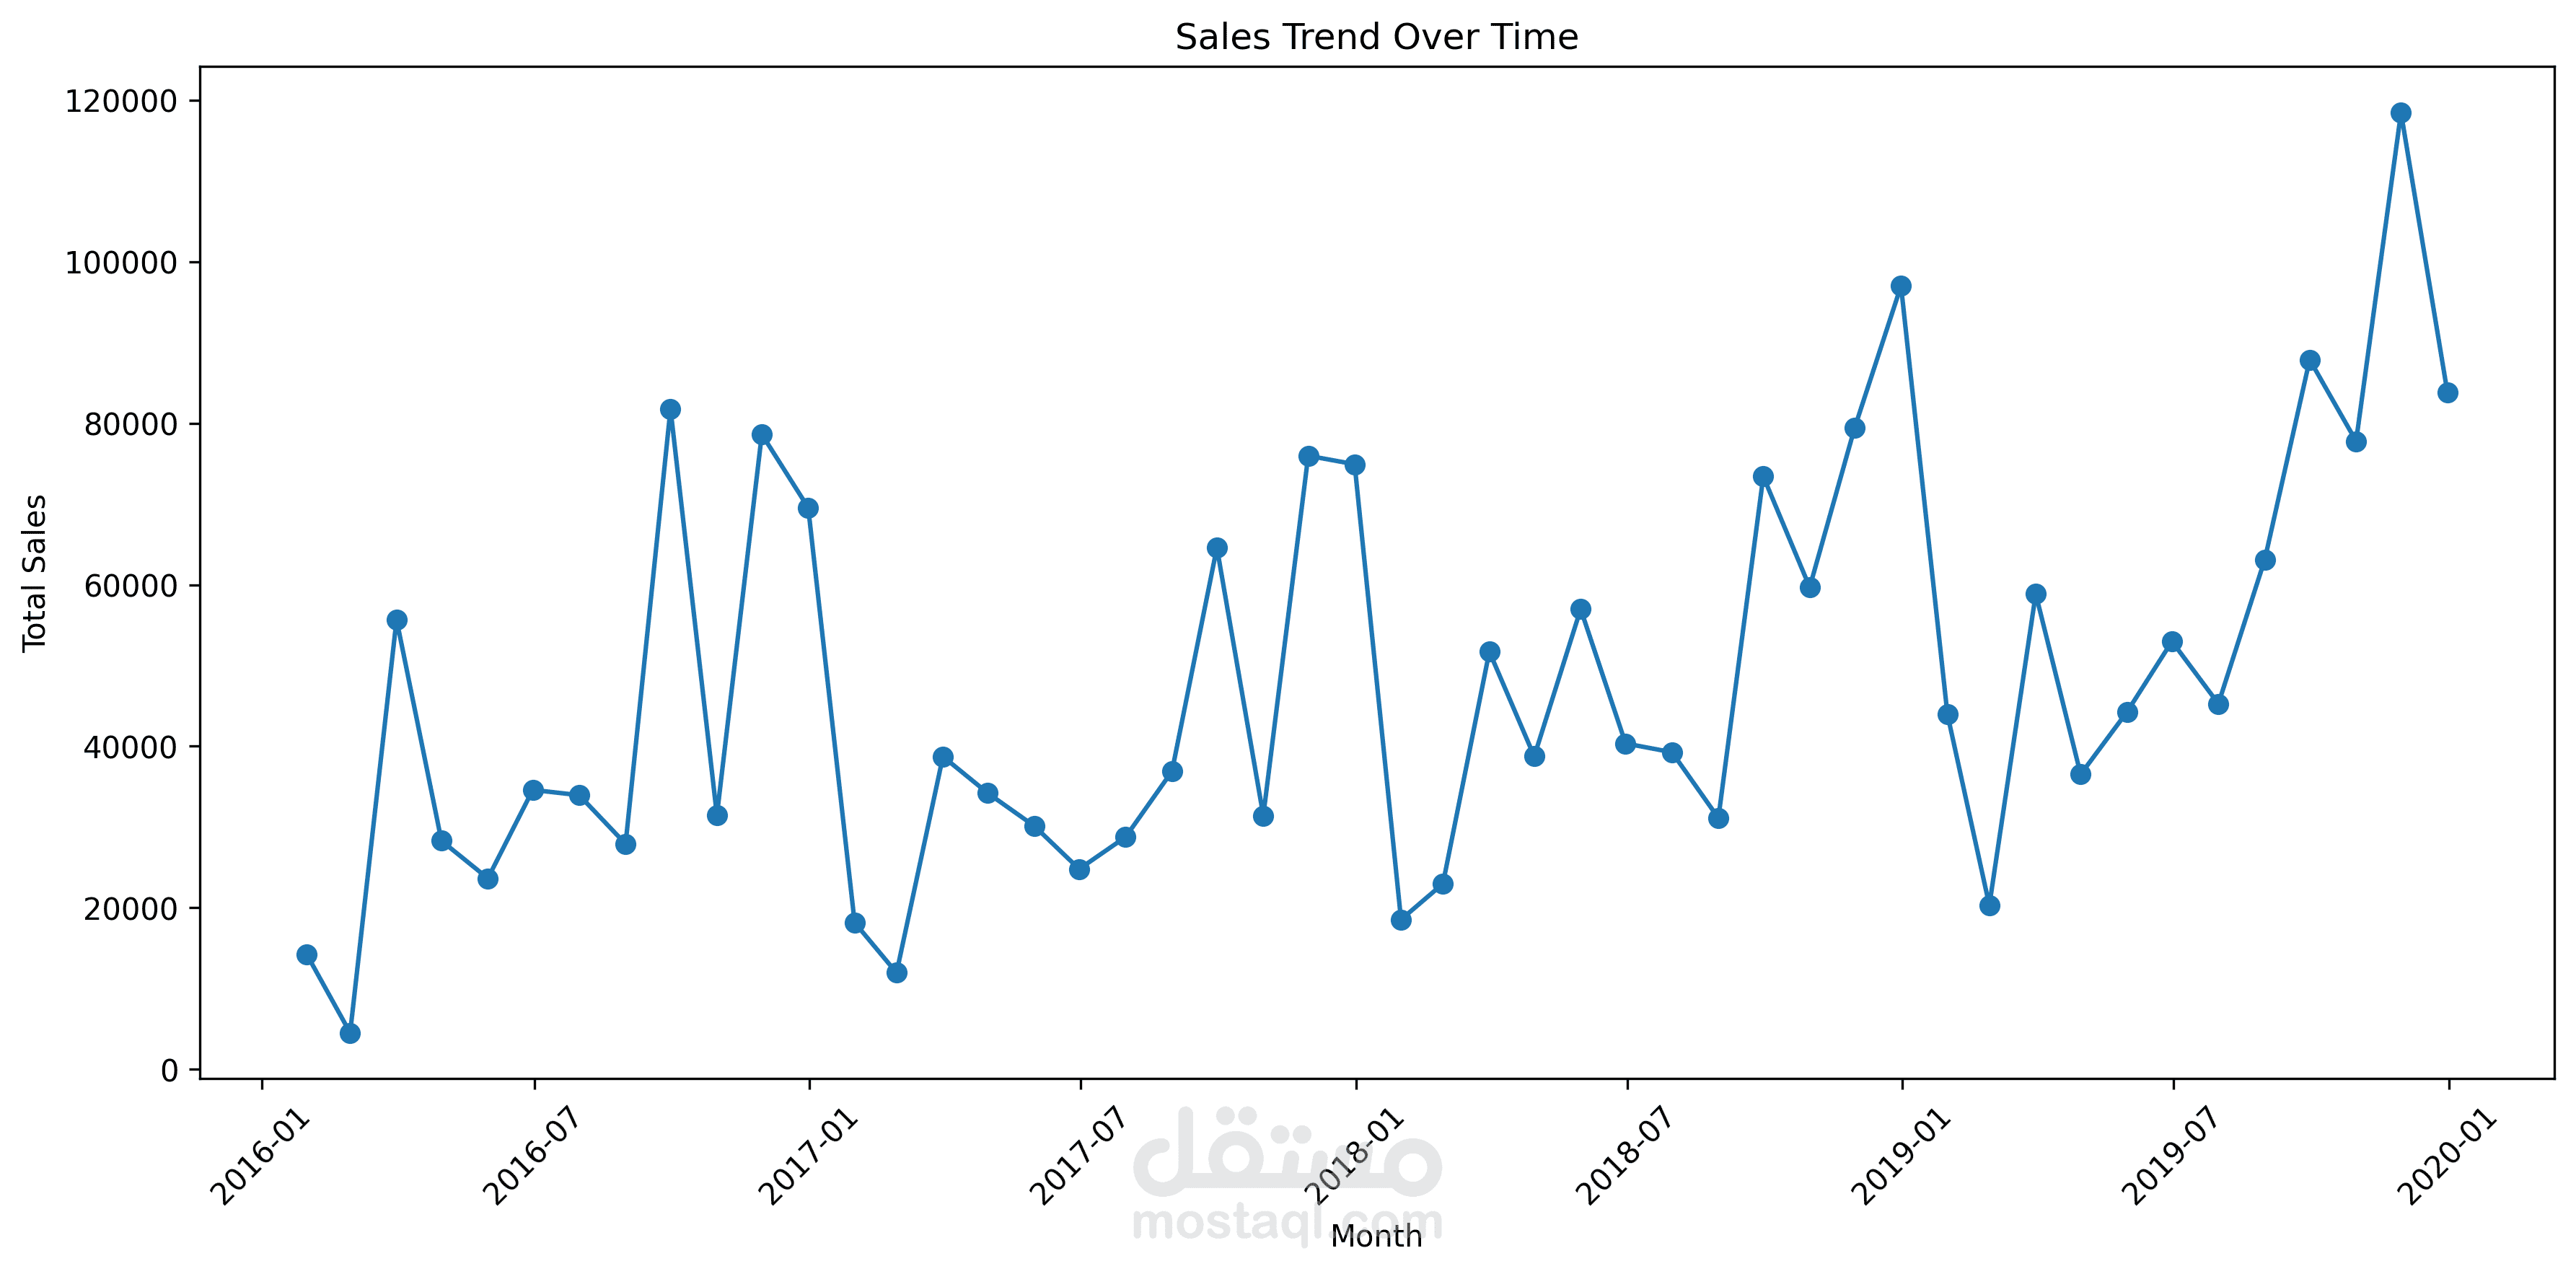
Monthly sales trends
Correlation Analysis
Built a correlation heatmap to examine relationships between Sales, Profit, Discount, Quantity, Profit Margin, and Shipping Duration.
Key observations included a moderate positive correlation between Sales and Profit, while higher discounts were associated with lower profitability.
Data Visualization
Created visualizations including:
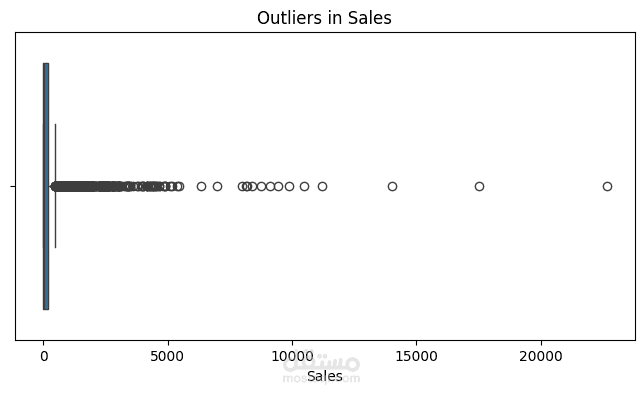
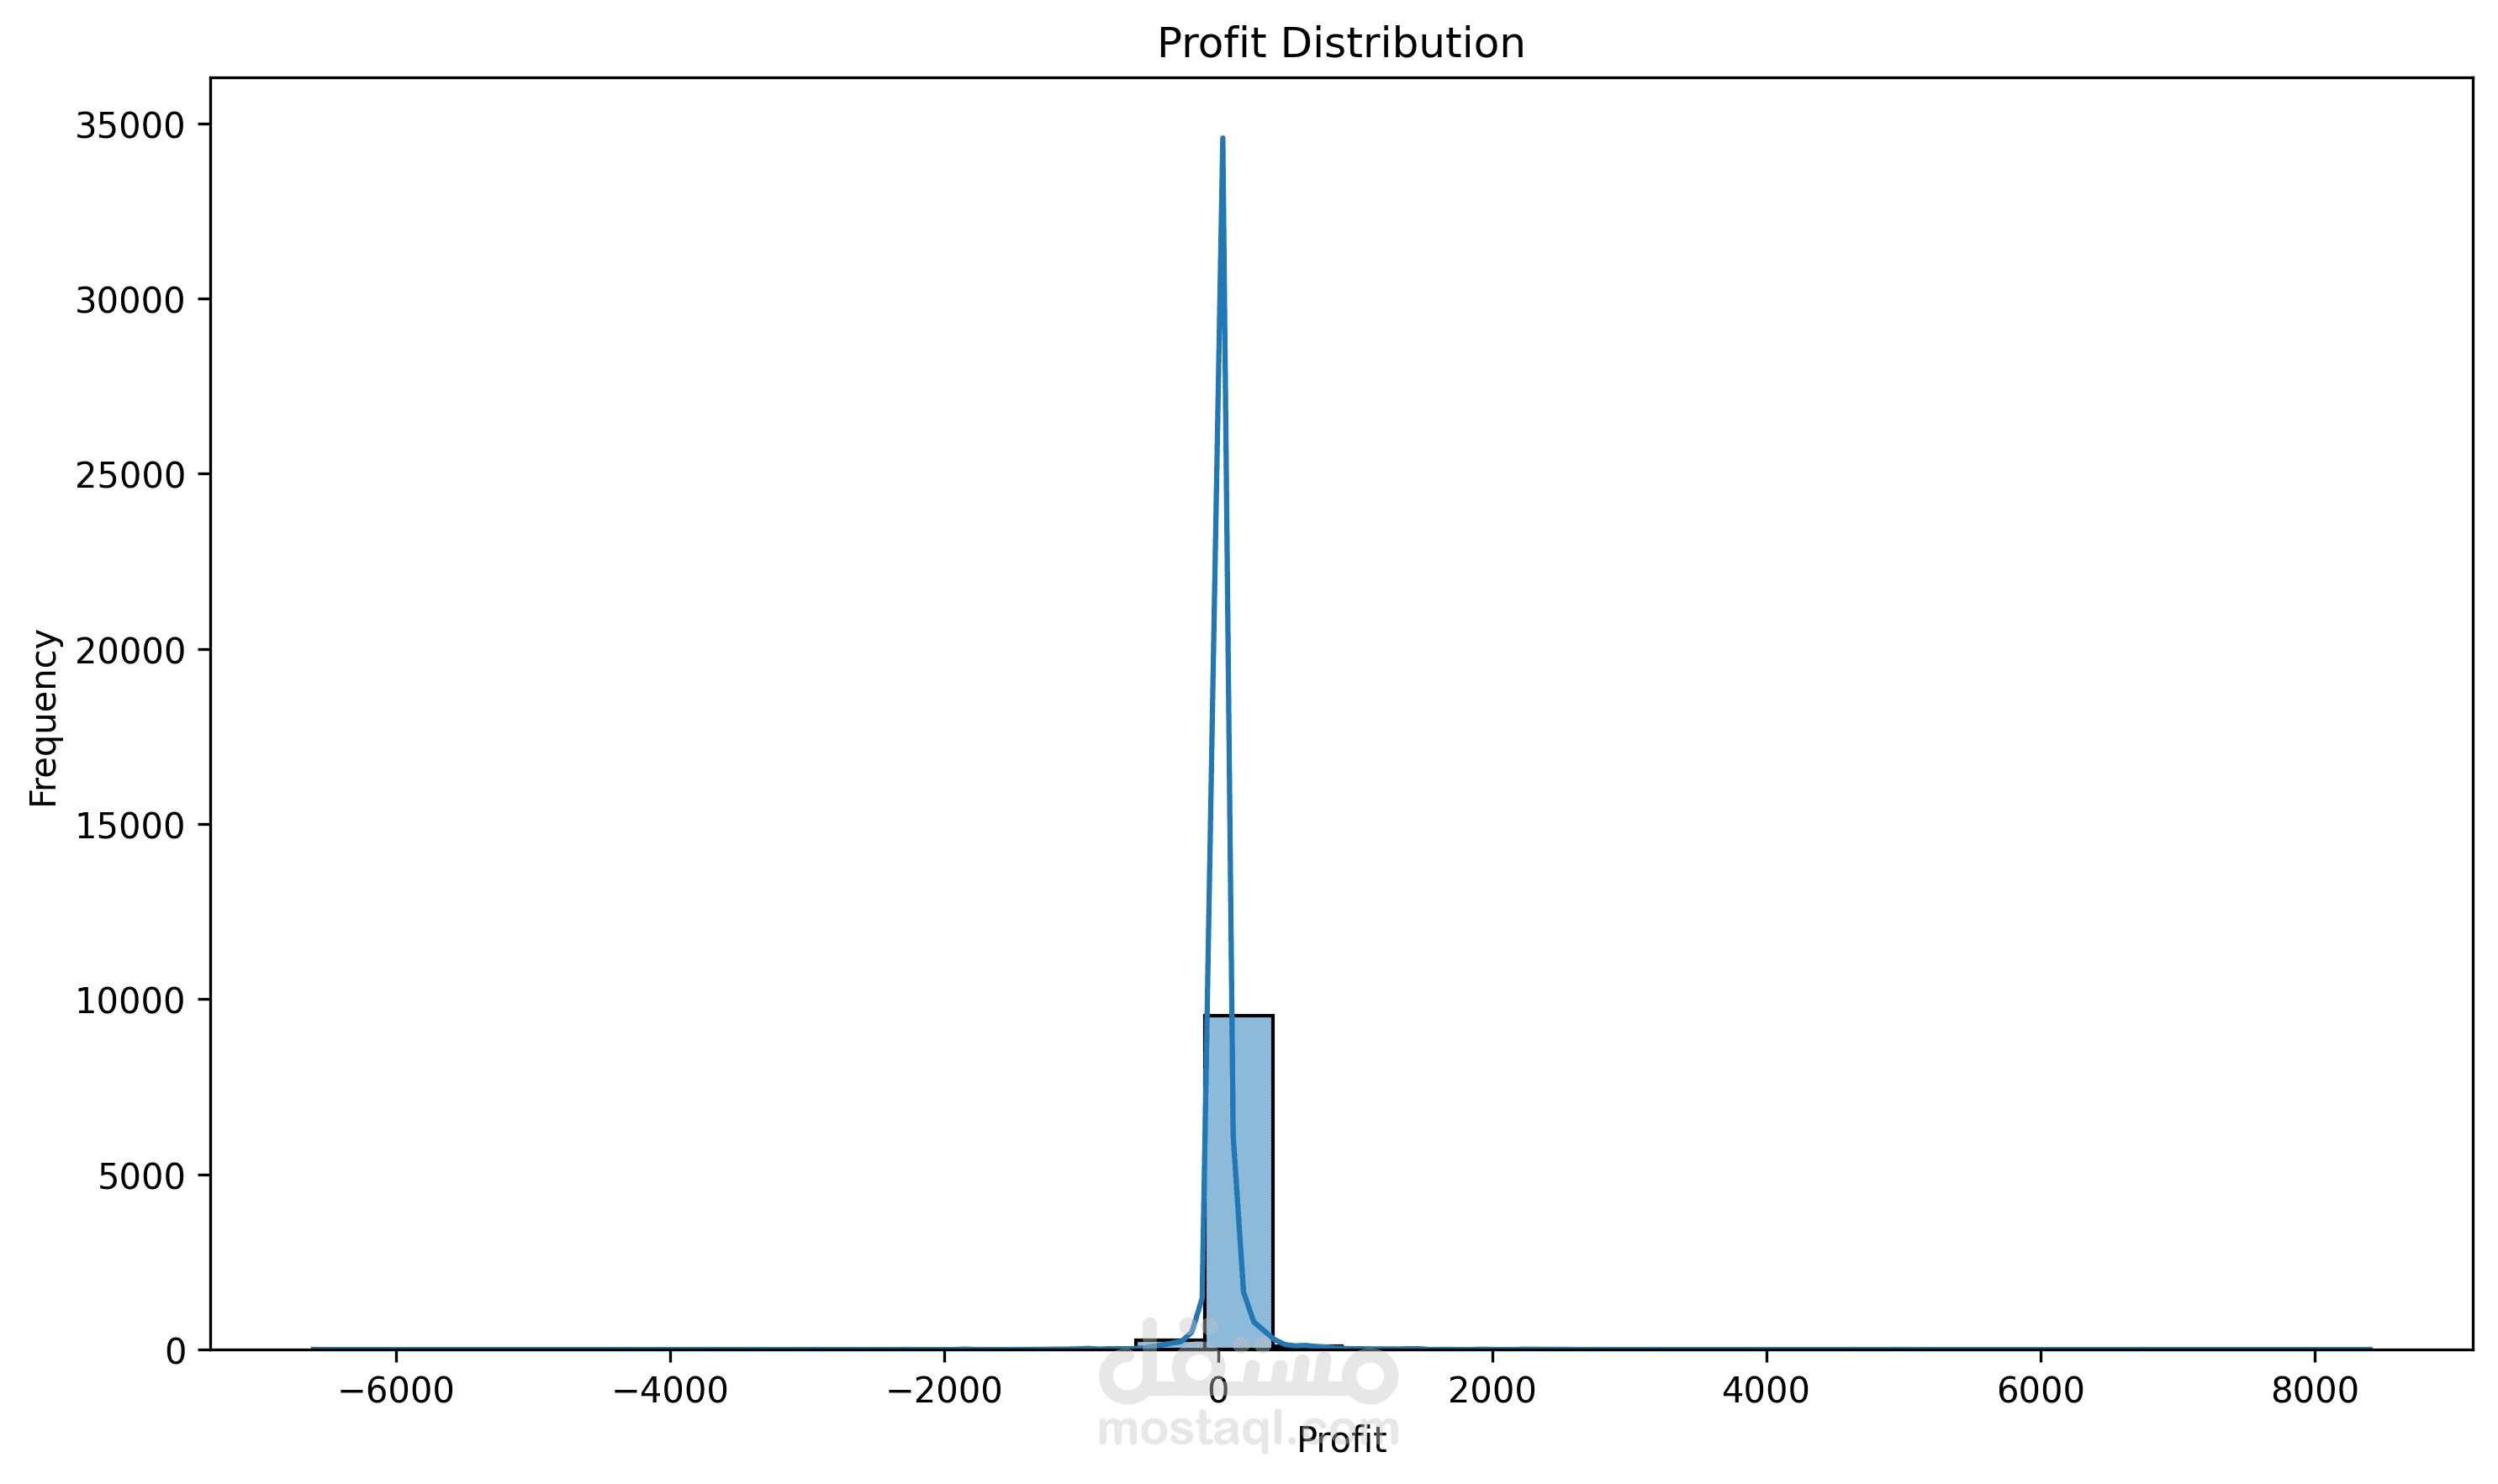
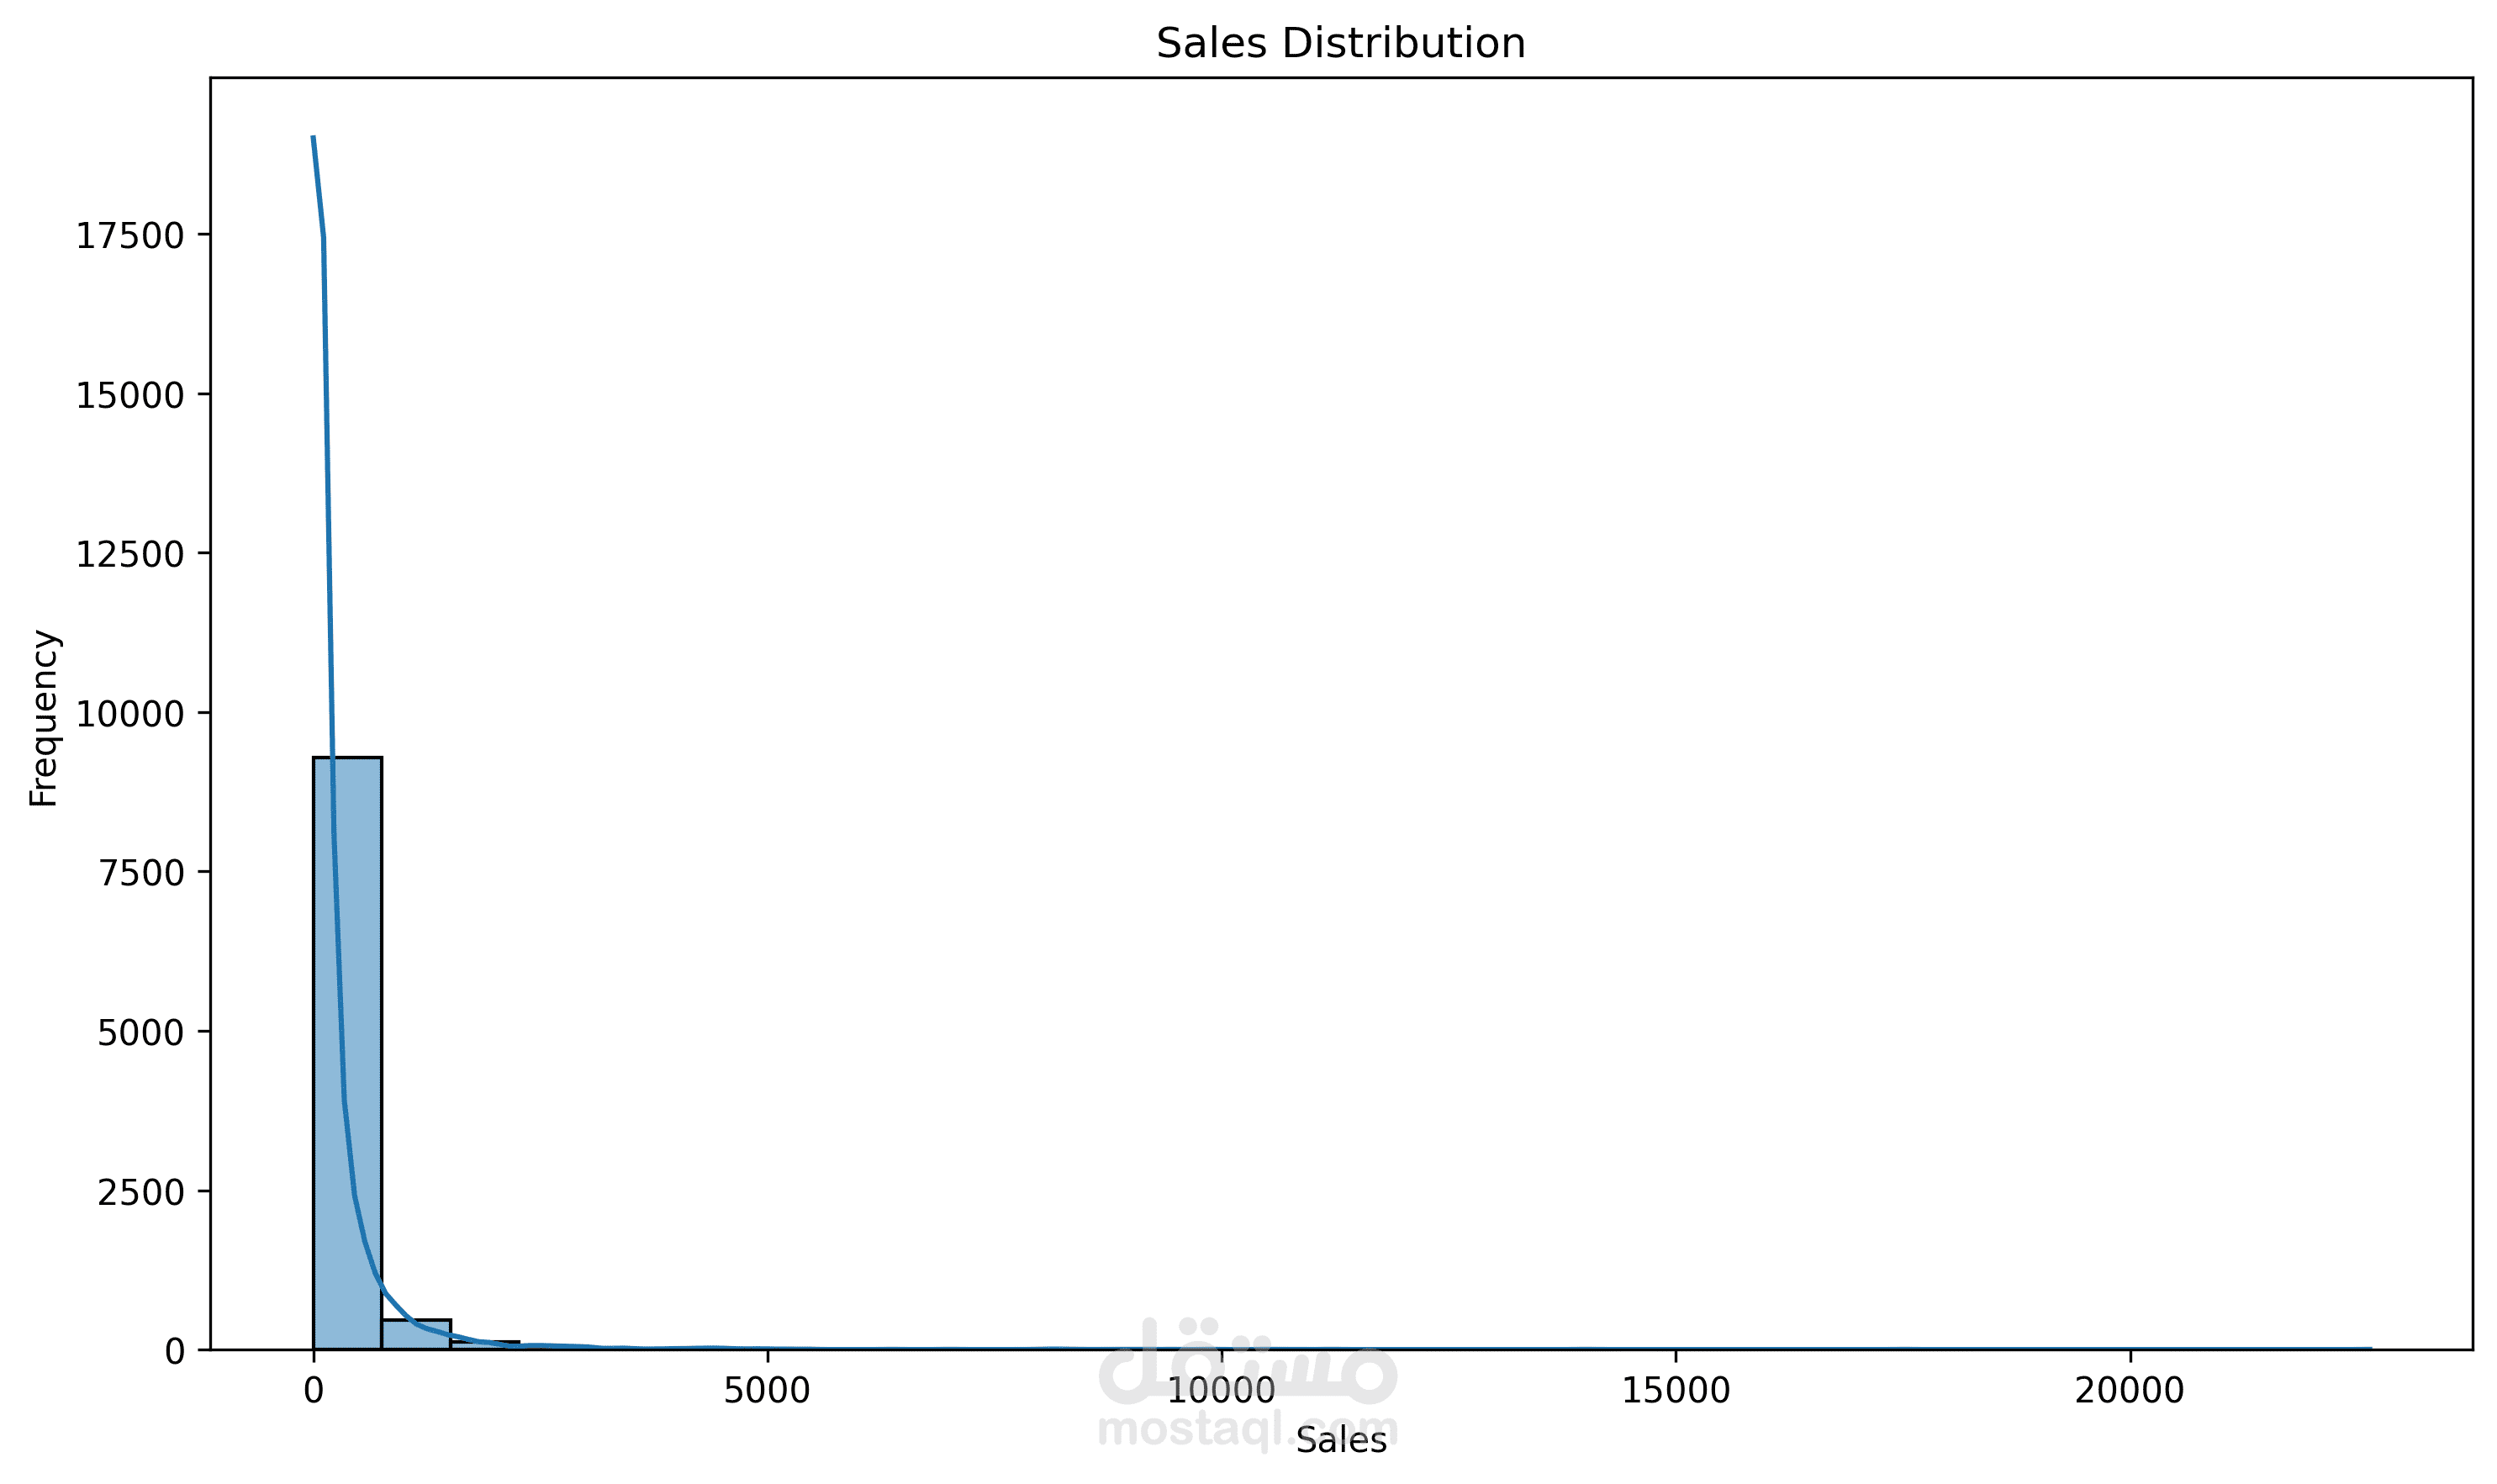
Sales and Profit distributions
Sales by Category
Profit by Category
Profit by Customer Segment
Average Profit by Category and Region
Monthly Sales Trend
Sales vs. Profit
Average Profit vs. Discount
Business Insights & Recommendations
The analysis identified several important patterns, including negative profitability at discount levels of 30% and above and cases where high sales did not necessarily result in high profit.
Recommendations focused on reviewing loss-making products, evaluating high-discount strategies, and considering profitability alongside sales when evaluating performance.
Tools & Technologies
Python, Pandas, NumPy, Matplotlib, Seaborn, Jupyter Notebook