Sales Performance Dashboard
تفاصيل العمل
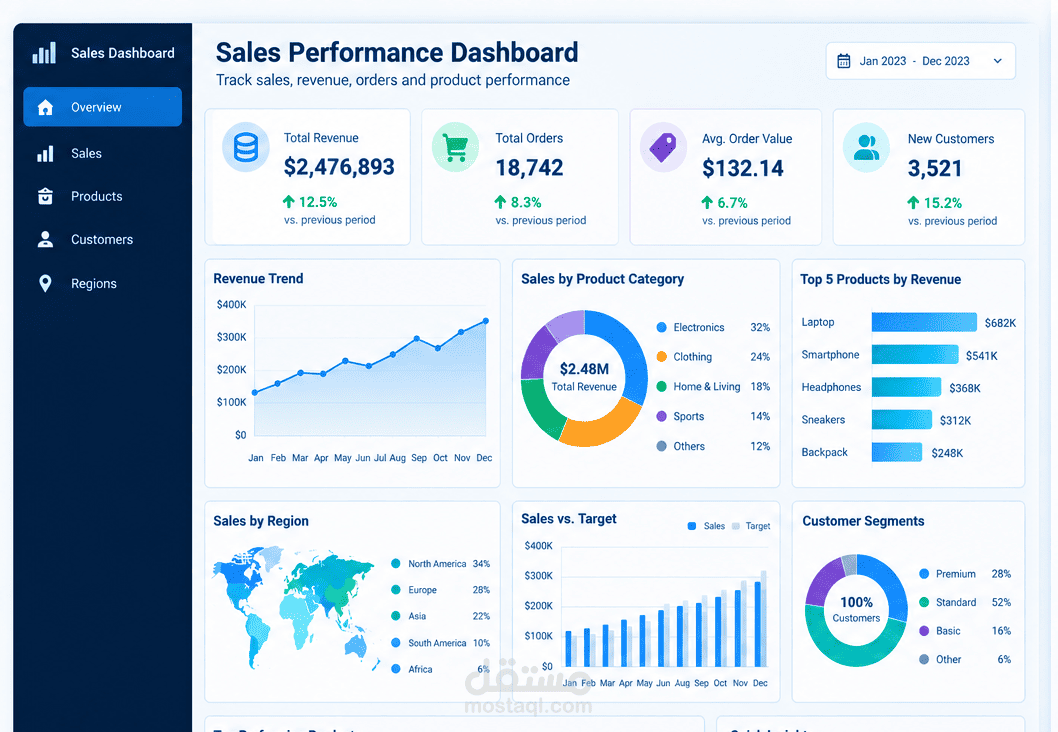
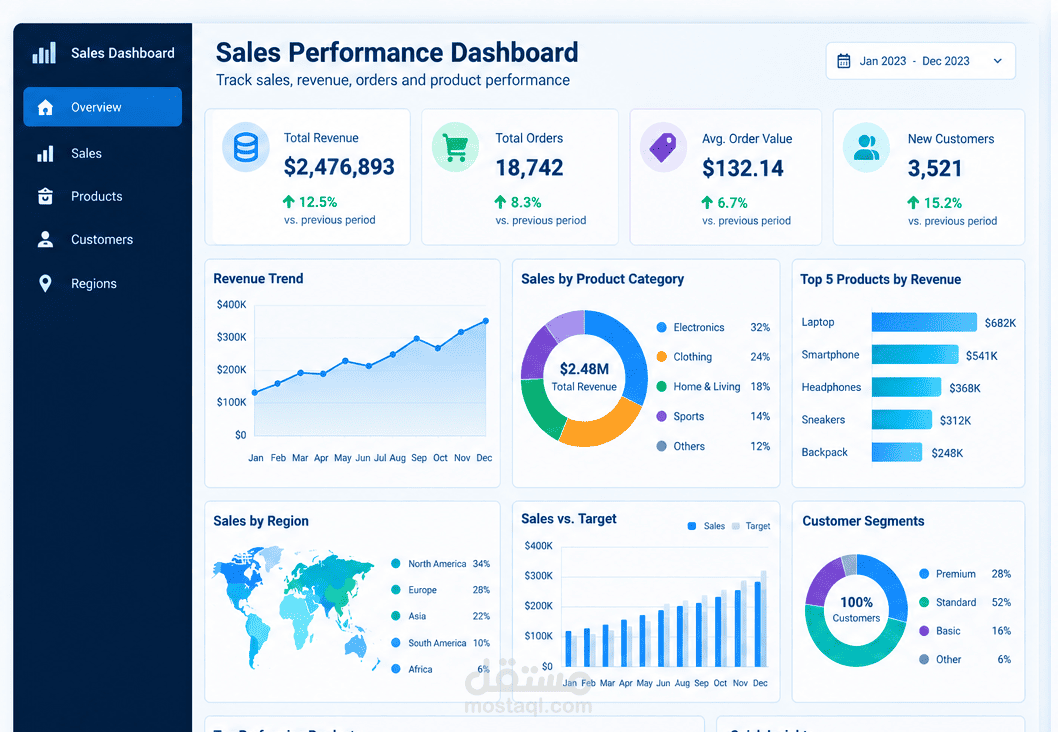
**Project Title:** Sales Performance Dashboard
**Project Description:**
This project focuses on analyzing sales performance and creating an interactive dashboard that helps businesses understand their revenue, orders, products, and regional performance. The dashboard provides a clear overview of key sales KPIs and helps decision-makers identify trends and high-performing products.
**Key Features:**
* Total Revenue, Total Orders, and Average Order Value KPIs
* Revenue trend analysis over time
* Sales by product category
* Top 5 products by revenue
* Sales performance by region
* Customer segmentation
**Tools Used:**
Microsoft Excel, Power Query, Power BI
**Skills Applied:**
Data Cleaning, Data Analysis, Data Modeling, DAX, Data Visualization, Dashboard Design
**Data Source:**
Excel / CSV sales dataset
**Project Outcome:**
The dashboard transforms raw sales data into clear and actionable insights that can support business decisions and improve sales performance.