diabetes visualization
تفاصيل العمل
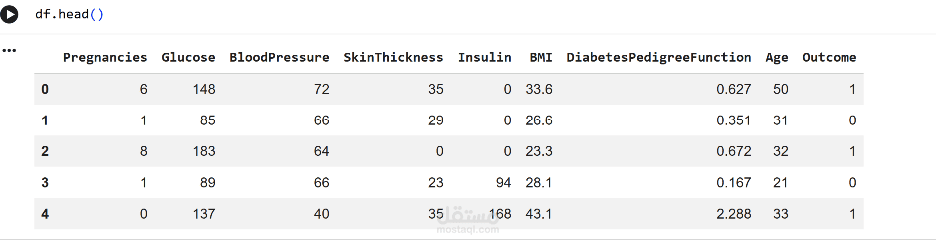
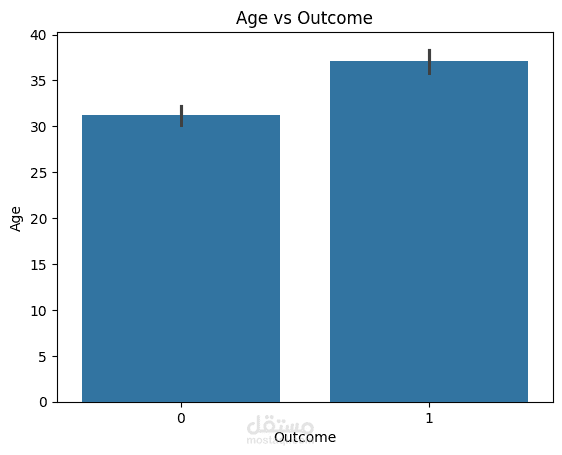
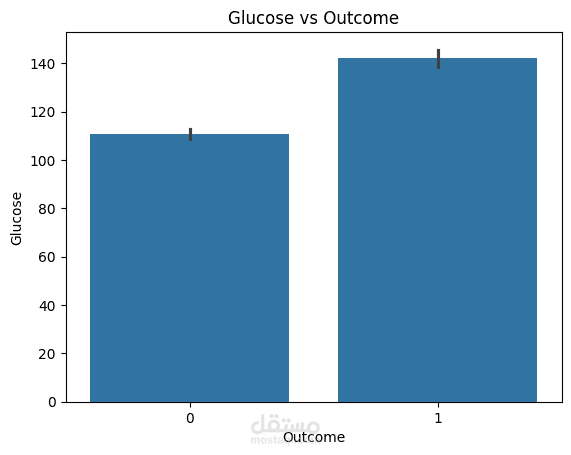
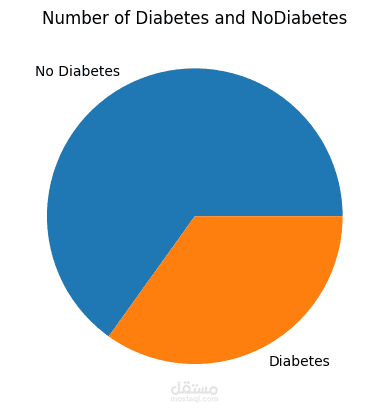
Created a data visualization project using a diabetes dataset to explore patterns and relationships between different health-related variables.
The project included:
• Data cleaning and preparation using Python and Pandas.
• Creating clear and informative charts using Matplotlib and Plotly.
• Visualizing relationships between variables such as glucose levels, BMI, age, and diabetes outcome.
• Identifying patterns and trends through data visualization.
• Presenting the results in a clear, organized, and easy-to-understand format.