Superstore Orders Dashboard(Power BI)
تفاصيل العمل
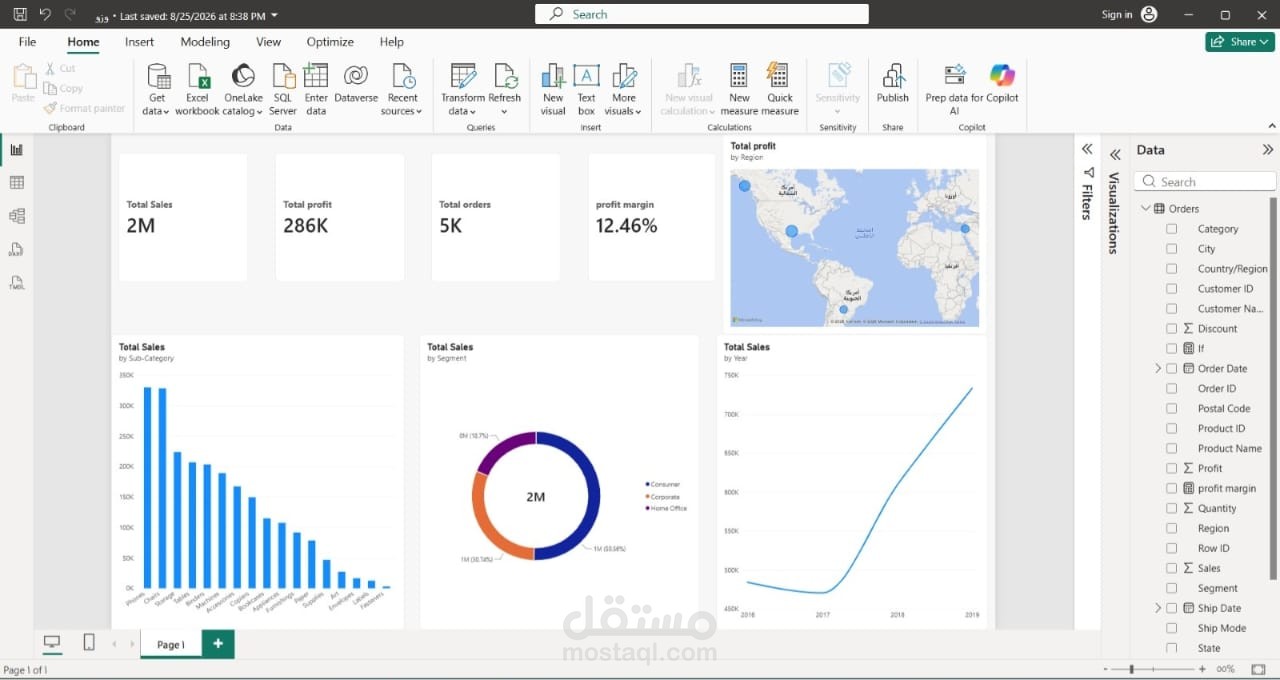
Transformed raw Superstore Orders data into an executive-ready Power BI dashboard designed to monitor business performance and facilitate data-backed decision-making.
Key Deliverables and Project Highlights:
Data Cleaning and Transformation (Power Query):
Audited and cleaned the Superstore Orders dataset.
Verified and set proper data types for all columns (Dates, Numeric values, Quantities).
Calculated custom fields for order delivery days and date hierarchies.
Core Metrics and Formulas (DAX Measures):
Total Sales: Sum of overall revenue.
Total Profit: Sum of net earnings.
Profit Margin (%): Calculated ratio of total profit to total sales.
Total Orders & Avg Delivery Days: Metrics for volume and operational fulfillment efficiency.
Multi-Dimensional Visual Layout:
Top KPI Cards: Quick access to essential financial and operational metrics.
Trend & Product Analysis: Line chart tracking sales over time and a bar chart identifying top sub-categories.
Segment & Geographic Insights: Donut chart displaying customer segments and a map visual showing profit distribution across regions.
UX & Layout Optimization:
Organized visuals into a balanced 2x2 grid structure.
Adjusted typography, header sizes, and formatting for optimal readability.