Sales & Profit Analytics Dashboard (Power BI)
تفاصيل العمل
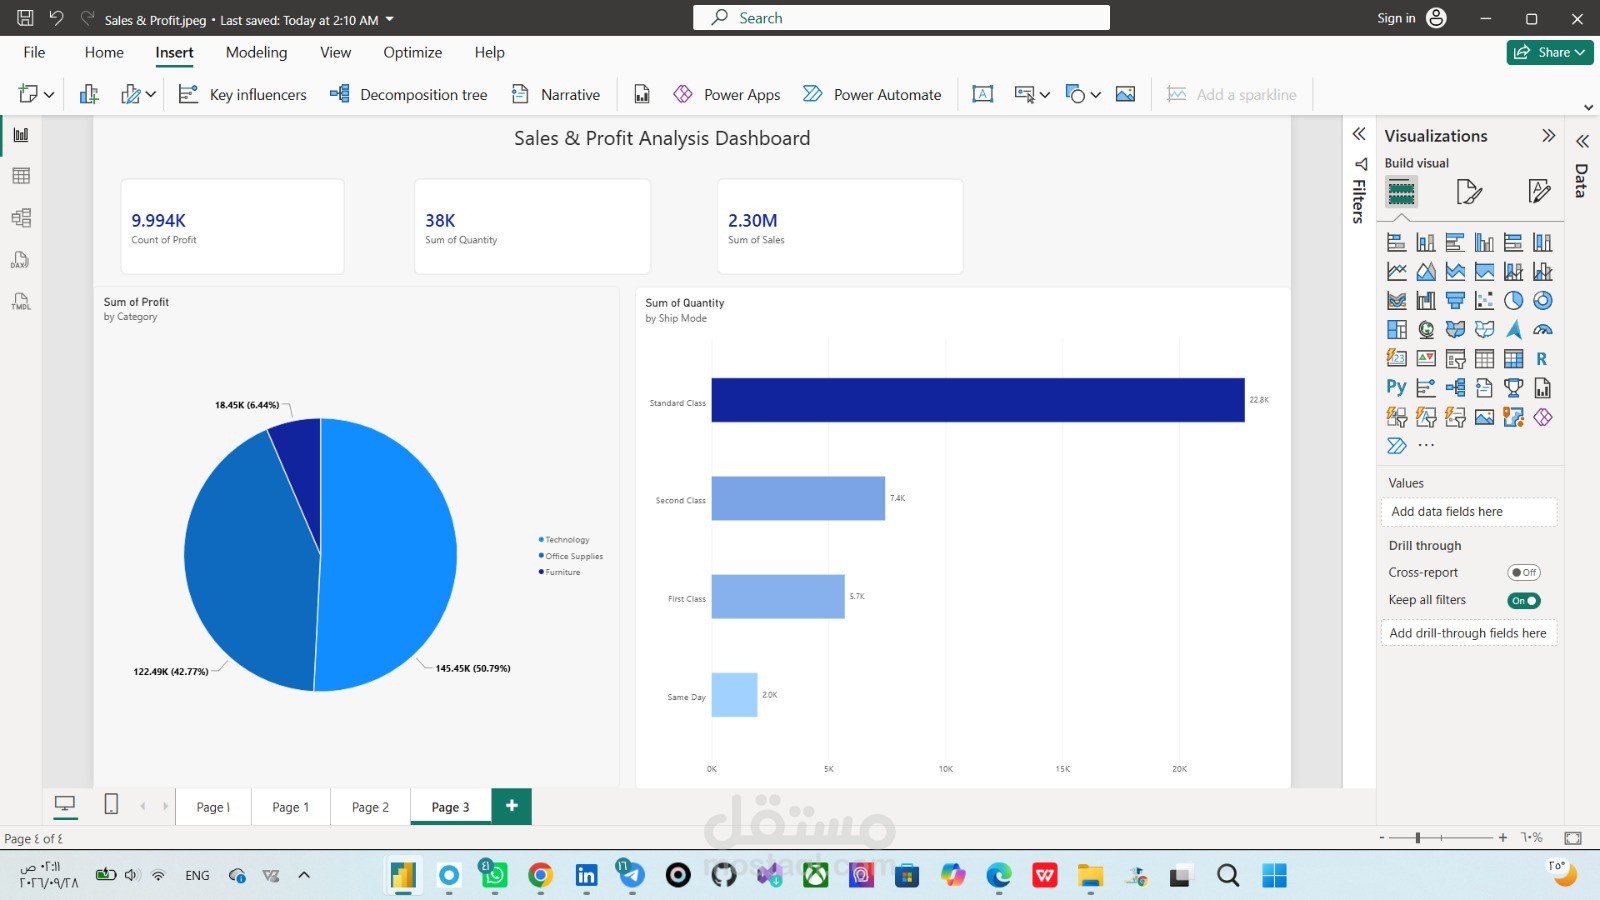
An interactive Power BI dashboard designed to analyze sales performance, profits, and customer orders for an e-commerce business.
What I Did in This Project:
Cleaned and organized the dataset using Power BI.
Created clear KPI cards for Total Sales ($2.30M), Total Profit ($286.40K), and Quantity Sold (38K).
Built visual charts to analyze profits across product categories (Technology, Office Supplies, Furniture).
Analyzed shipping modes and order distribution.
Designed a clean and easy-to-use visual dashboard for business decision-making