CUSTOMER RISK ANALYSIS DASHBOARD
تفاصيل العمل
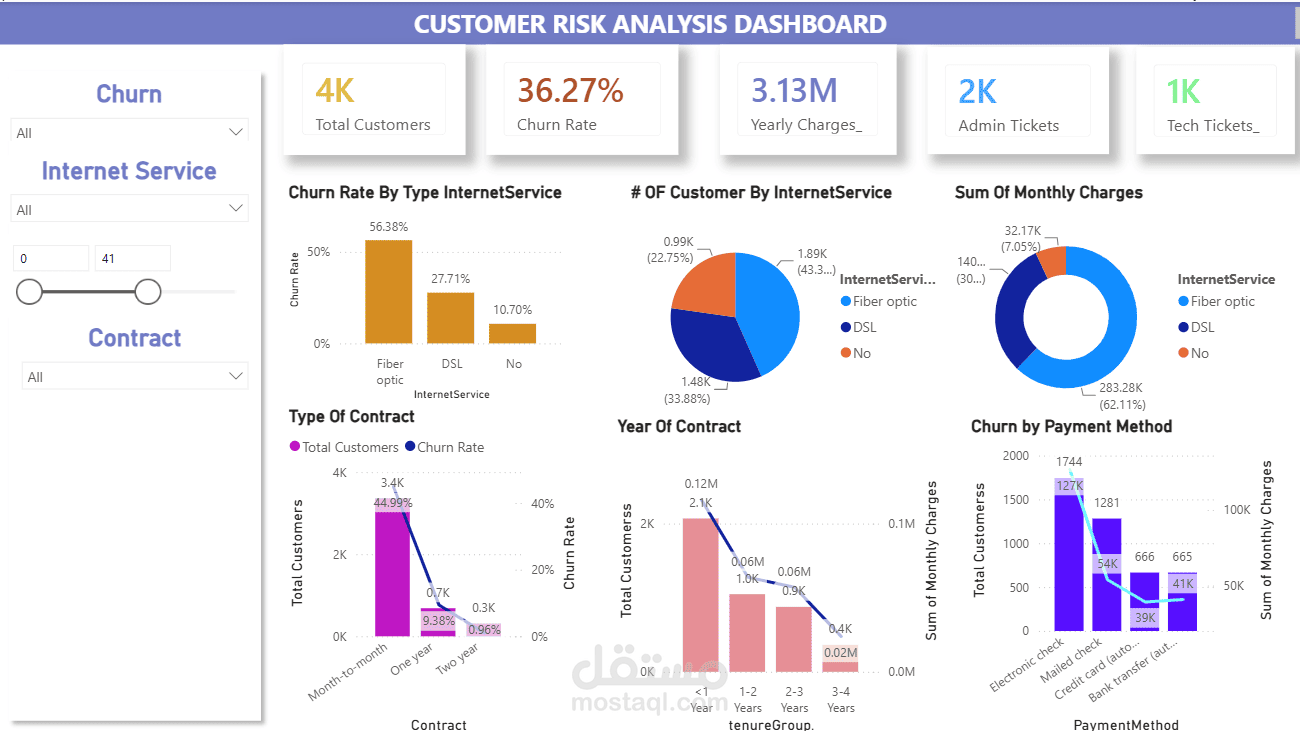
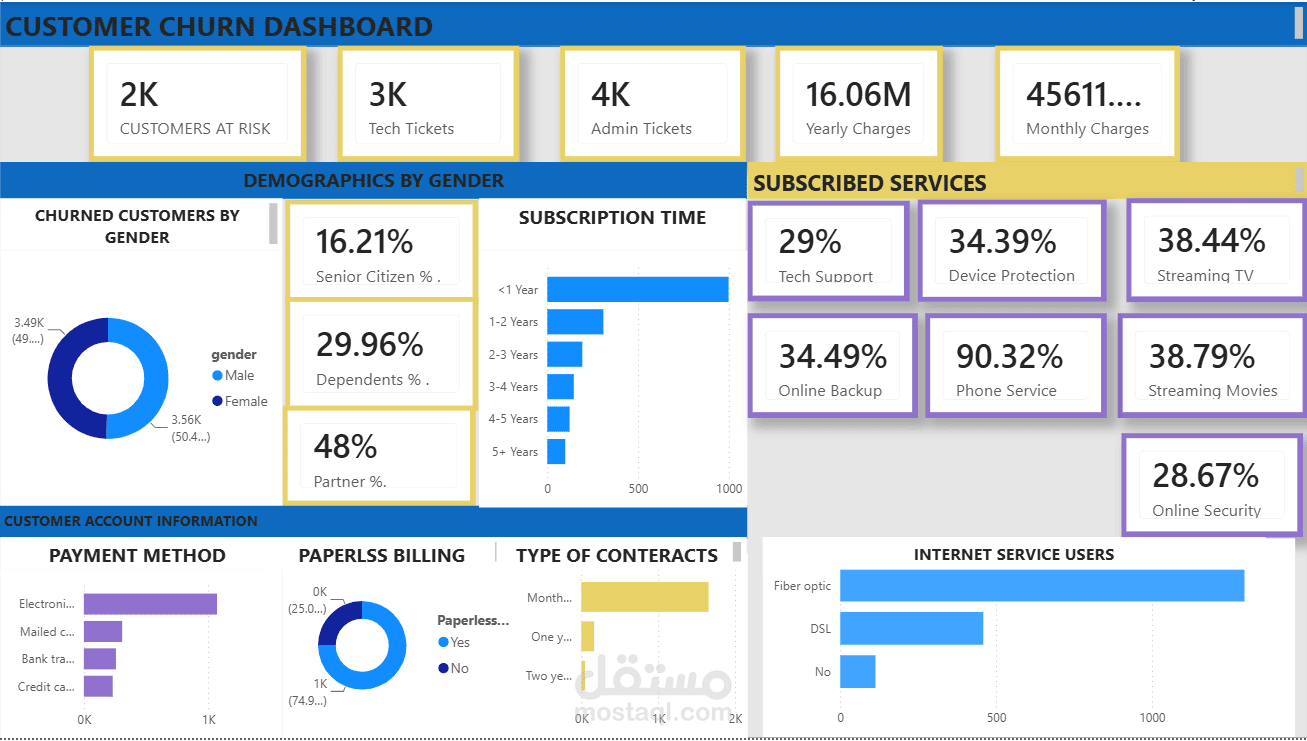
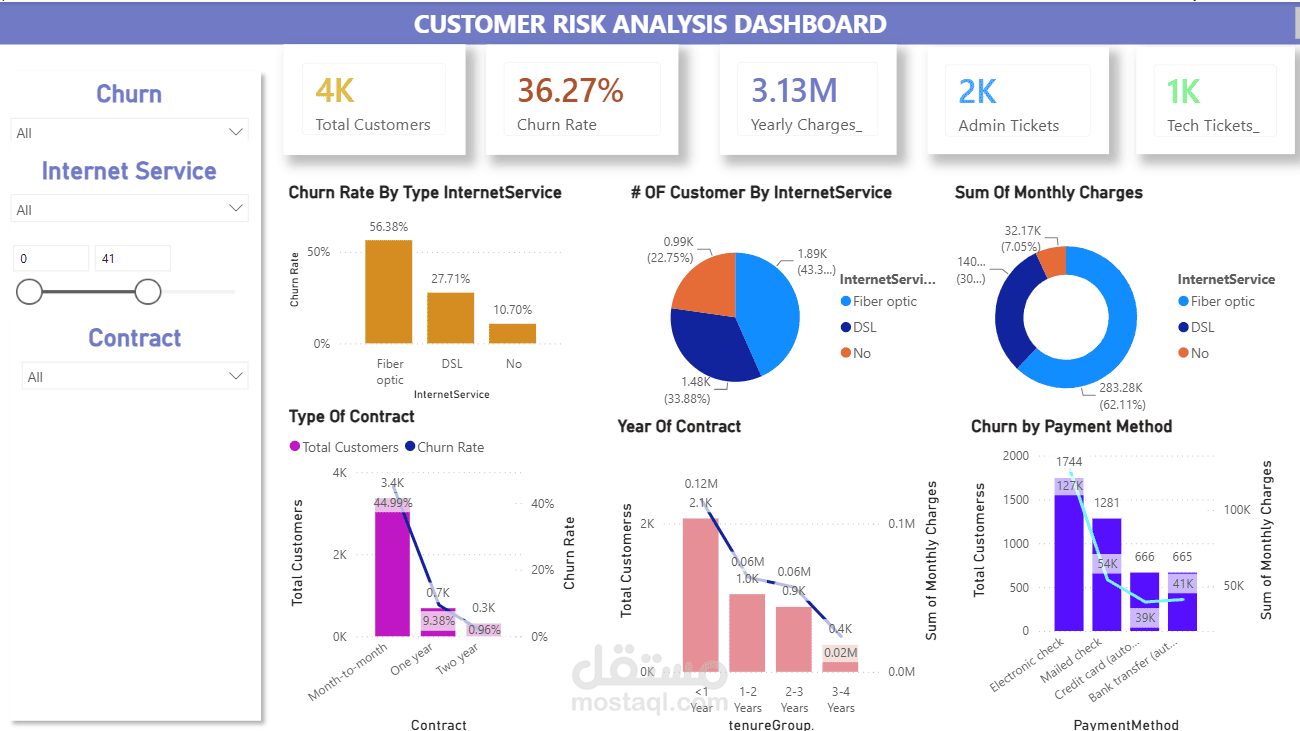
Designed and built two interactive Power BI dashboards to analyze customer churn for a telecom company (36.27% churn rate). The dashboards track key KPIs and break churn down by internet service, contract type, tenure, payment method, and customer demographics. The analysis showed that fiber optic users (56%) and month-to-month contracts (45%) had the highest churn, especially among customers in their first year. These insights help support targeted retention strategies, such as promoting longer contracts and improving service for high-risk segments.