Superstore Retail Analytics: End-to-End Python Data Pipeline
تفاصيل العمل
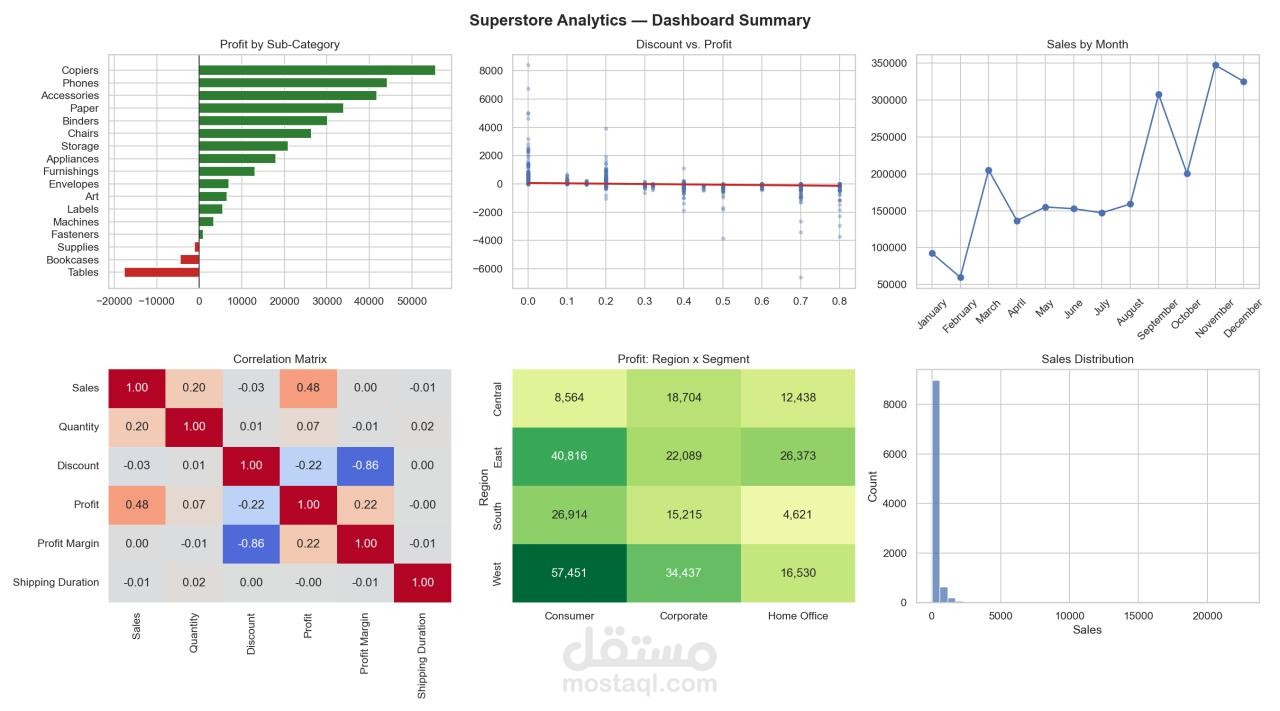
Built an end-to-end analytics pipeline for a multinational retail company's Sample Superstore dataset (9,994 orders, 21 columns), covering data cleaning, feature engineering, statistical analysis, visualization, and automated KPI reporting.
Designed as 5 independent, reusable Jupyter notebooks — each reads its input from disk rather than from another notebook's memory, so an issue in one stage never breaks the pipeline.
Key work:
- Built reusable OOP pipelines (SuperstoreCleaner, FeatureEngineer) with custom exception handling for cleaning (missing values, duplicates, inconsistent formatting, IQR-based outlier detection — 1,162 orders flagged and retained as legitimate high-value orders) and memory optimization.
- Engineered features: Profit Margin, Shipping Duration, Sales Performance Category, Discount Bucket, calendar features.
- Ran correlation, distribution, and trend analysis with scipy.stats significance testing.
- Produced 11 Matplotlib/Seaborn visualizations (10 individual + 1 assembled dashboard).
- Automated KPI summary generation and Markdown reporting via a custom KPIReportGenerator class.
Results: $2,288,271 total sales, $284,152 total profit (12.42% margin) across 5,003 orders, averaging $457.38 per order and 4.0 days shipping duration. Discount and Profit are significantly negatively correlated (r = -0.22) — deeper discounting erodes margin. West/Consumer is the strongest Region × Segment pairing ($57,451 profit), while Tables, Bookcases, and Supplies are the biggest drags on profitability.
Tools: Python, Pandas, NumPy, Matplotlib, Seaborn, SciPy.
Completed as part of the Digital Egypt Pioneers Initiative (DEPI) Data Analyst track, under the guidance of Waleed Mouhammed, Senior Data Analysis Instructor.