B2B SaaS Customer Insights & Revenue Risk
تفاصيل العمل
Business Problem
A B2B SaaS company was suffering from department silos: Product didn't know which features actually drove adoption vs. frustration, Support was drowning in tickets, and Customer Success saw high churn without knowing the root cause. The Product Manager needed clear answers to shape the roadmap and a set of prioritized, actionable recommendations — not just charts.
My Approach
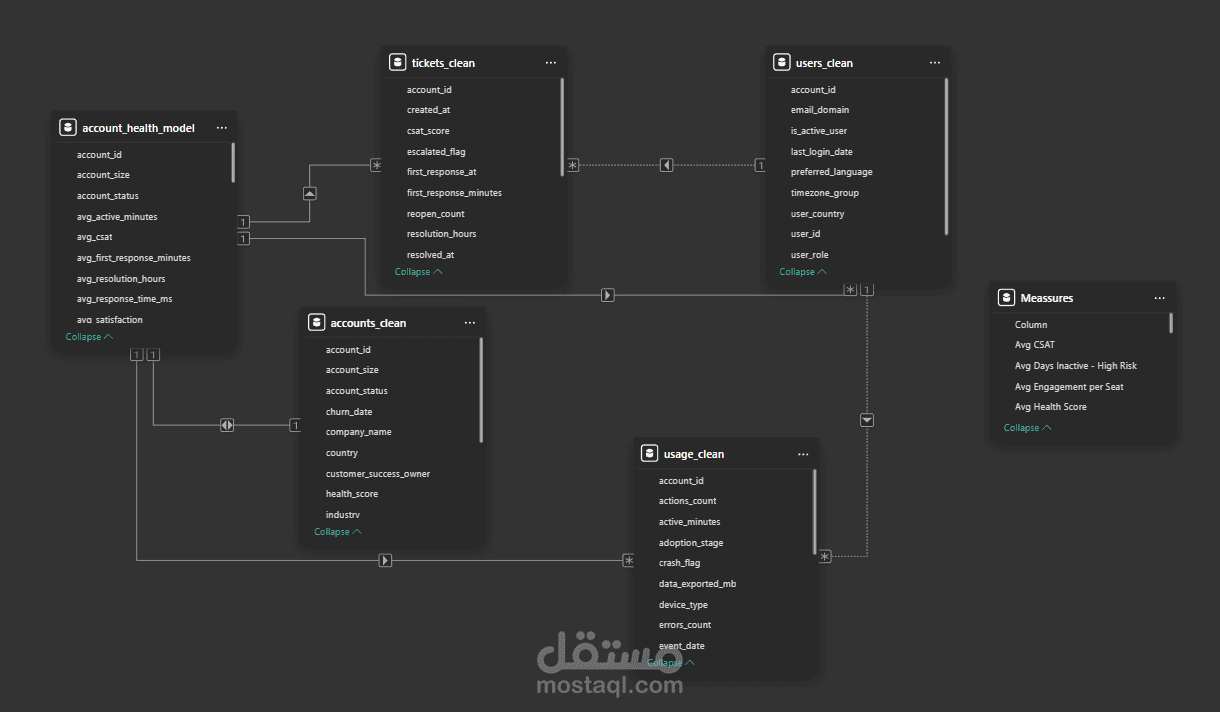
Cleaned and modelled ~470,000 records across 4 raw tables (Accounts, Users, Product Usage, Support Tickets) in Python/Pandas — handling impossible negative values, sentinel placeholders (e.g. 99999 seats), 99th-percentile capping, chronological integrity checks (onboarding dates before signup, resolved tickets before first response), and referential integrity across tables. Then designed a custom Risk Scoring Algorithm weighting health score, error rate, ticket/escalation pressure, and 365-day inactivity, and built a full Power BI star schema (fact tables usage_clean & tickets_clean against dimension tables accounts_clean, users_clean, and a health model) with DAX measures isolated in their own table.
Key Findings
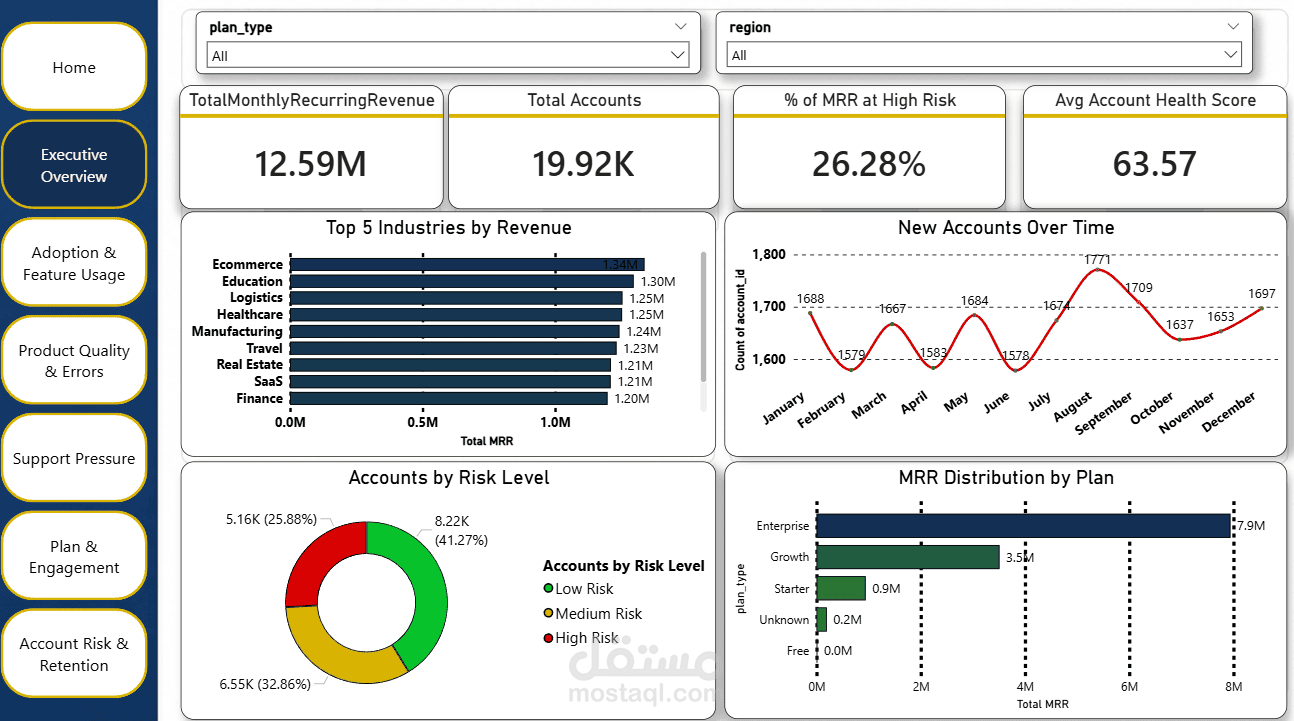
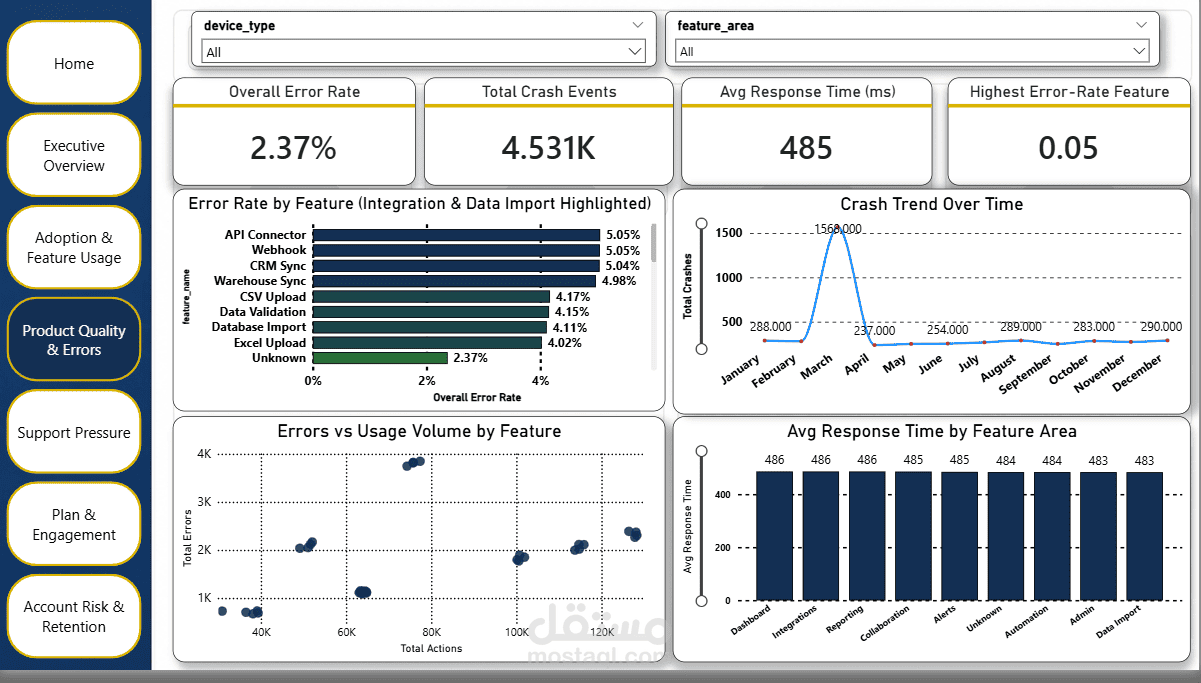
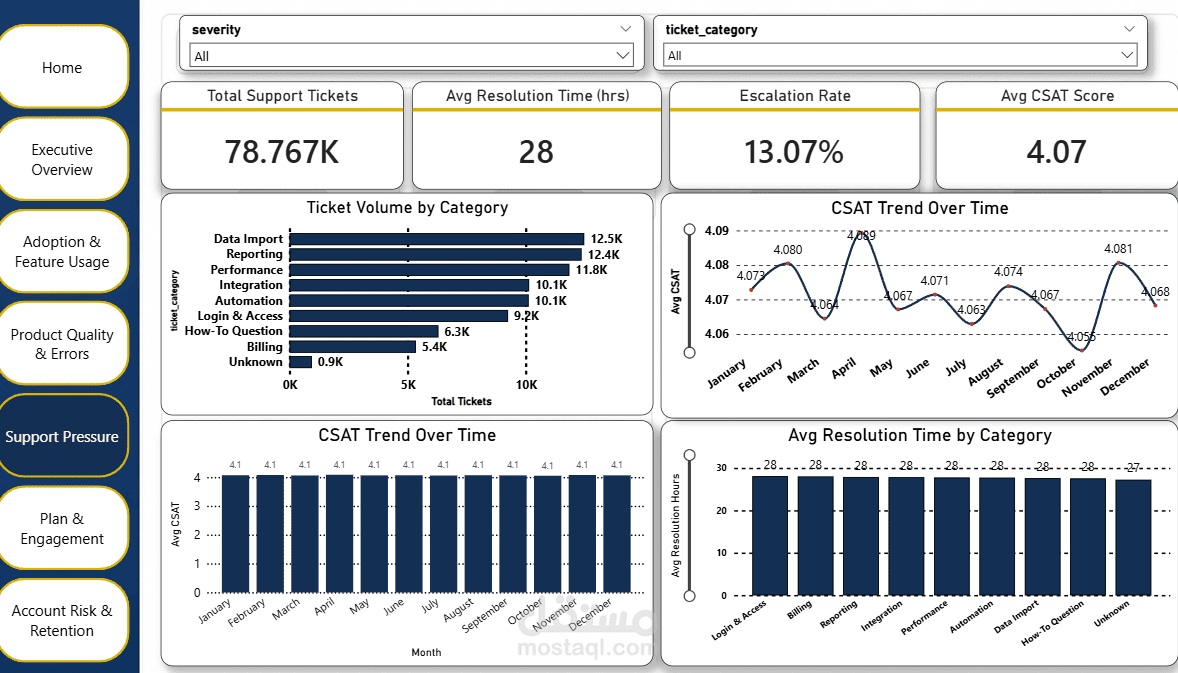
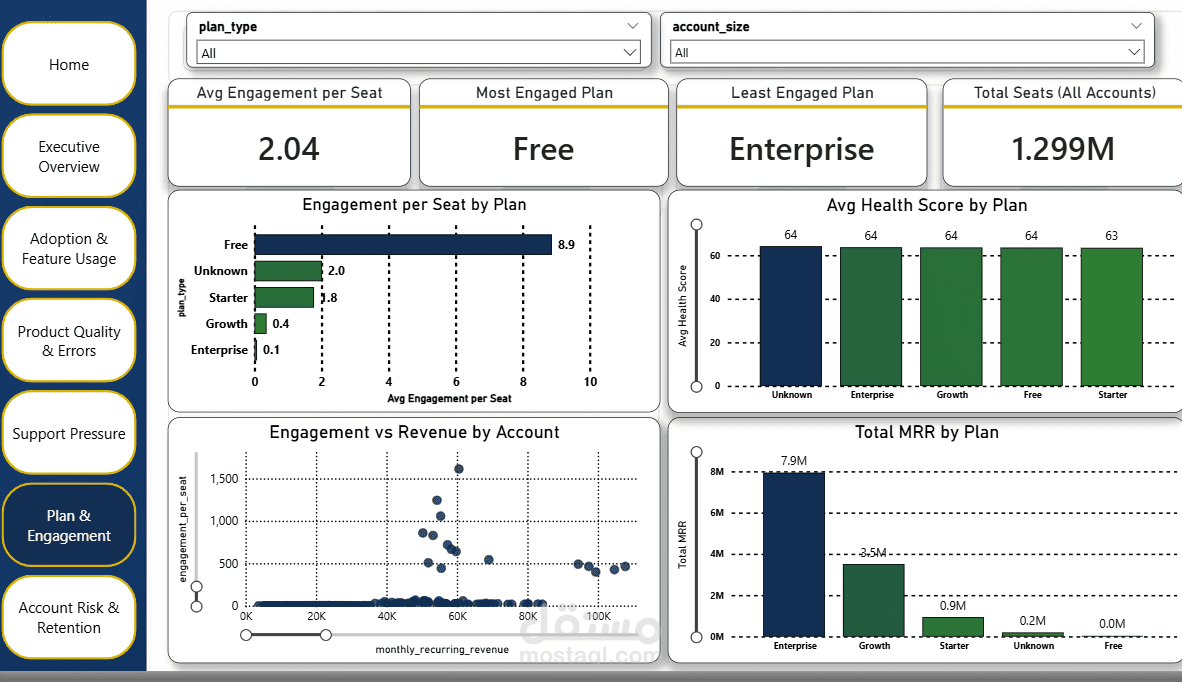
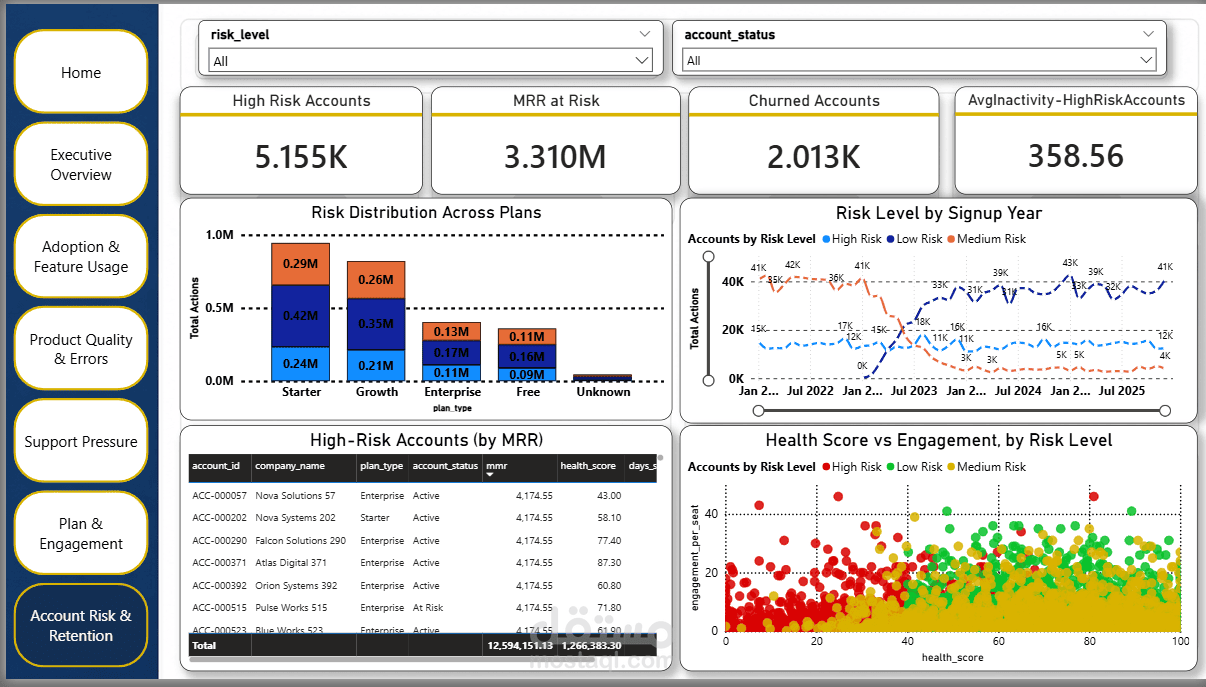
Data Import was the #1 driver of support load at 12,472 tickets — traced back to Integrations (CRM Sync, API Connector) and Data Import features carrying the highest in-app error rates (31–36%), proving the root cause was an engineering/pipeline problem, not a support-efficiency one. Separately, Enterprise-tier accounts held the largest revenue block ($7.9M of $12.59M total MRR) yet had the lowest engagement-per-seat (0.07 vs. 8.87 for Free-tier) — a classic "Shelfware" pattern signaling over-provisioned licenses and weak onboarding. The Risk Scoring model showed 26.3% of total MRR ($3.31M) sitting inside High-Risk accounts, plus 6,545 Medium-Risk accounts needing immediate outreach.
Impact
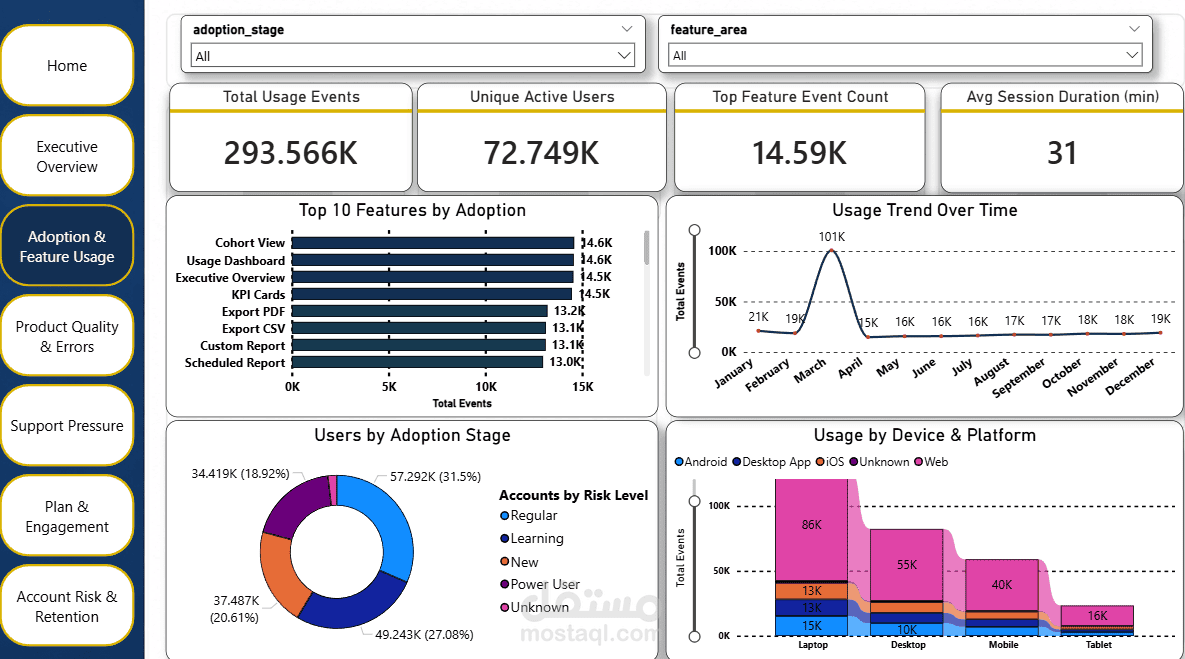
Delivered a 7-page interactive Power BI dashboard (Executive Overview, Adoption & Usage, Product Quality & Errors, Support Pressure, Plan & Engagement, Account Risk & Retention) alongside a prioritized action plan: P1 — Engineering fixes Integrations/Data Import to cut error rate below 10% (–40%+ support load) plus an immediate CS save-play for at-risk Enterprise accounts; P2 — an early-warning workflow for Medium-Risk accounts; P3 — doubling investment in the highest-adoption features (Cohort View, KPI Cards).