product analysis
تفاصيل العمل
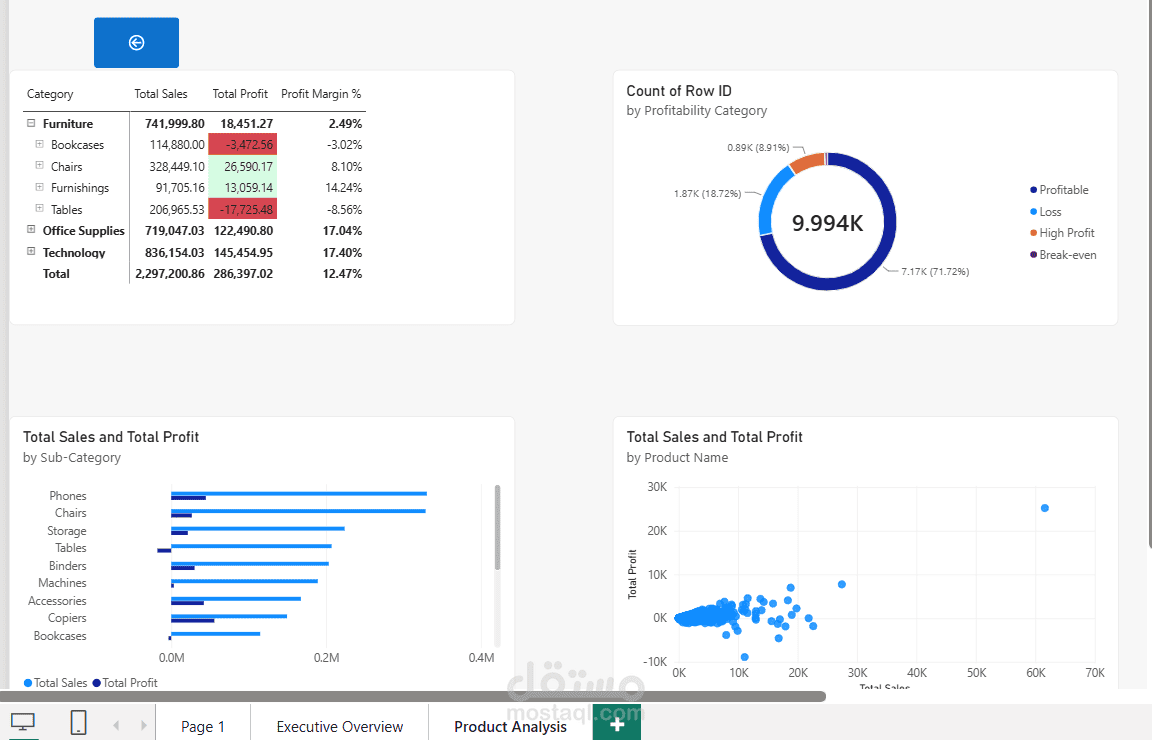
Product Performance Analysis with Drill-Through (Power BI)
Some products make money while others quietly lose it — the trick is knowing which is which. On this page I built a product-level analysis that answers that question in seconds: a hierarchical matrix breaking down every category and product, profit figures color-coded in red and green so losses jump out immediately, and a scatter plot revealing the link between sales and profit. With drill-through navigation, any product is one click away from its full story.