Sales data analysis — Python & Pandas
تفاصيل العمل
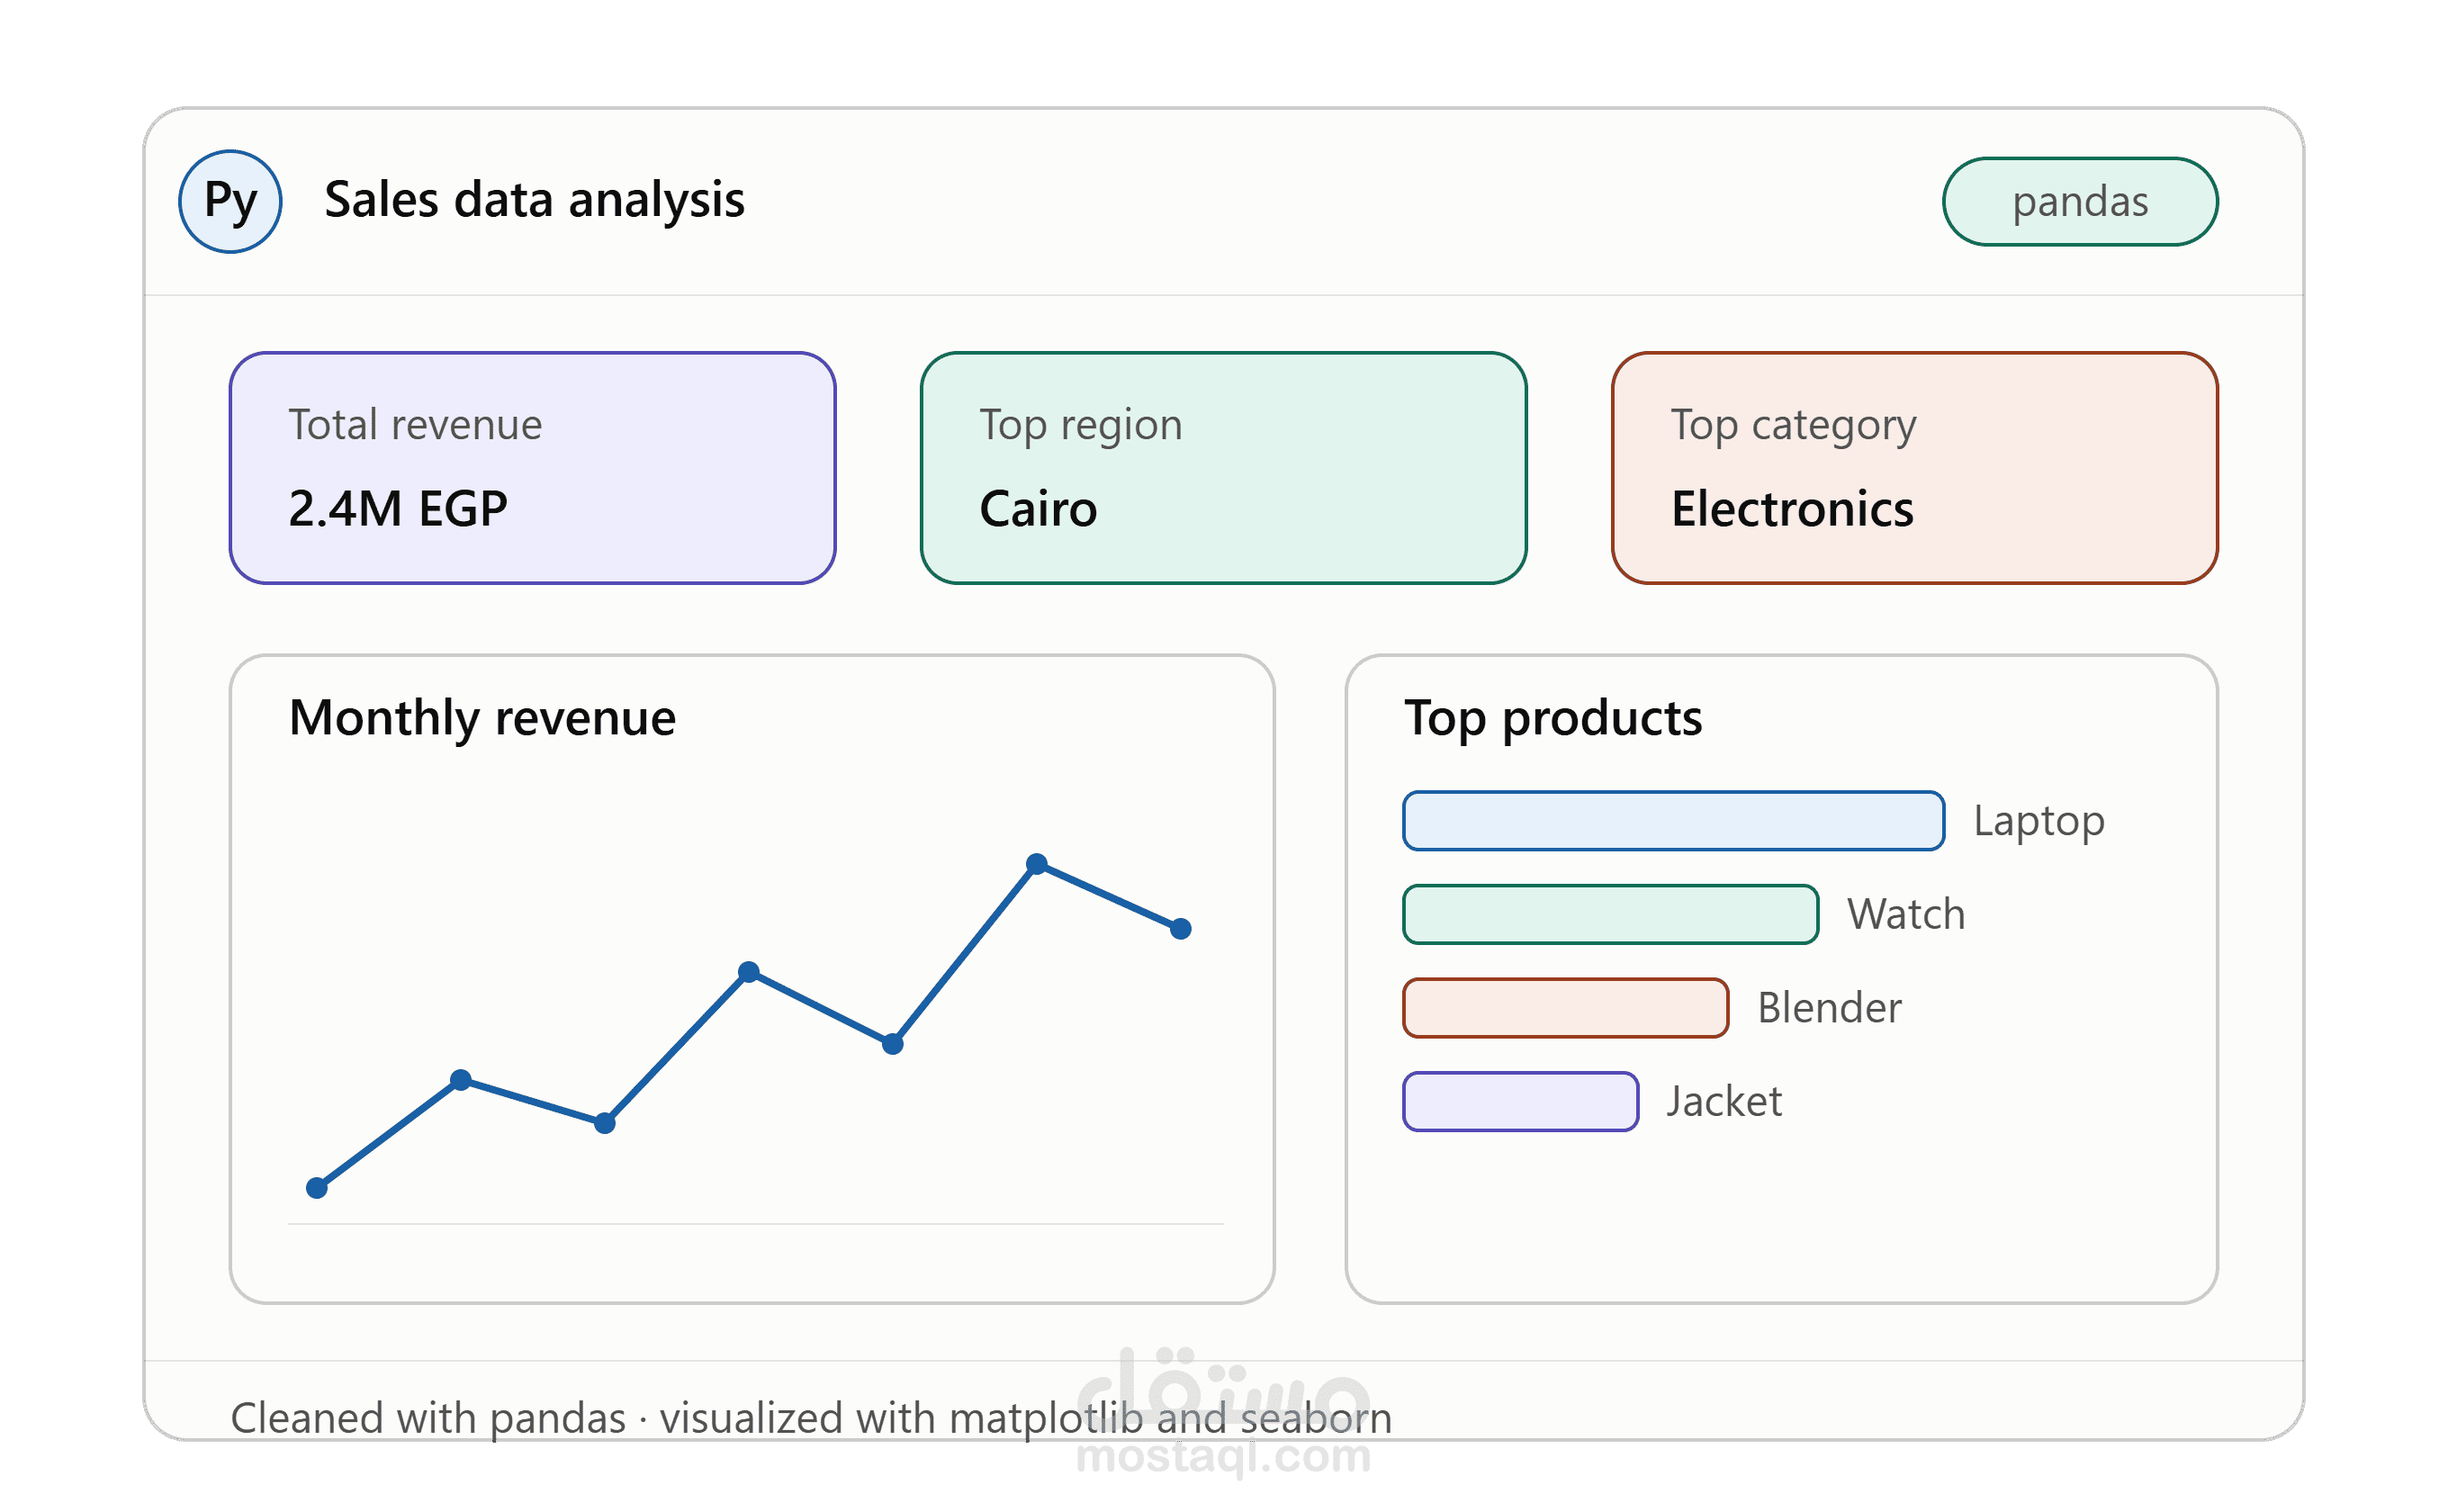
Loads a year of retail sales transactions (region, category, product, quantity, price)
Cleans the data with pandas: standardizes text, removes duplicate orders, handles missing values
Analyzes monthly revenue trends, best-selling products, regional performance, and category performance over time
Visualizes everything with matplotlib and seaborn
Summarizes the findings in a short written insights section