Loan Portfolio Analysis | Power BI Dashboard
تفاصيل العمل
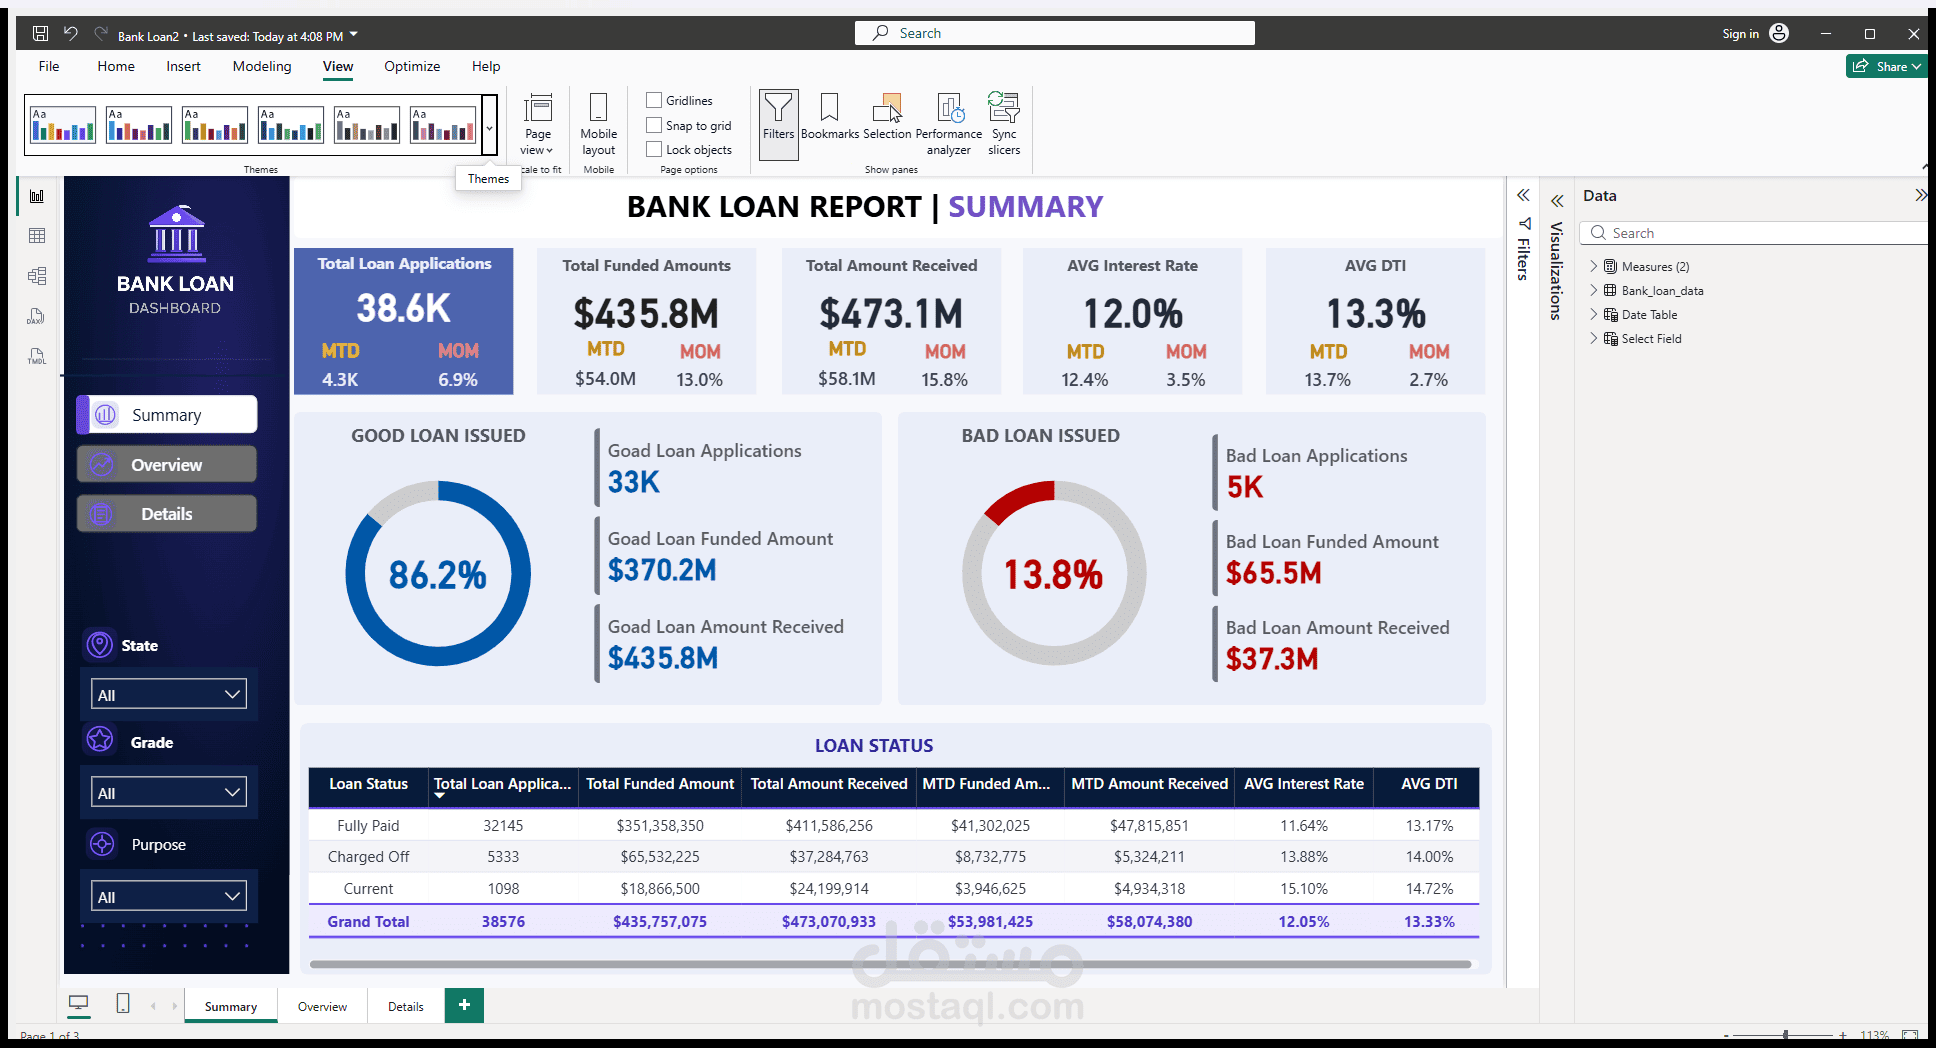
A Power BI dashboard designed to analyze loan applications, funded amounts, repayments, and borrower characteristics.
I created DAX measures to track total applications, total funded amount, total amount received, average interest rate, and average debt-to-income ratio. The report includes month-to-date, previous-month-to-date, and month-over-month comparisons to monitor changes over time.
The analysis explores the portfolio by loan status, grade, subgrade, term, and state, with interactive filters for detailed exploration.
The dashboard provides a clear overview of lending activity and supports comparisons across borrower and loan segments.
Tools: Power BI and DAX.