Pizza Sales Analysis | Power BI & SQL
تفاصيل العمل
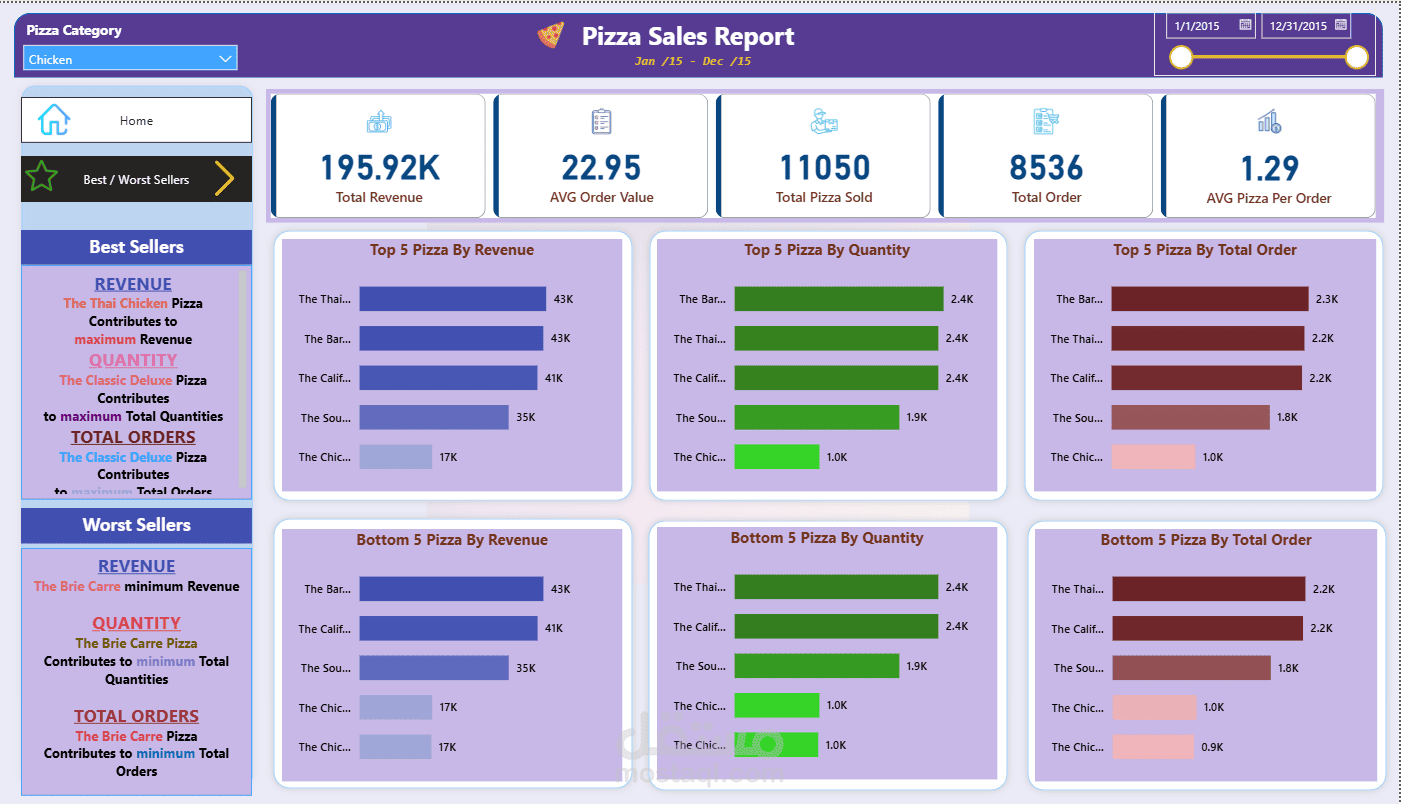
An interactive sales dashboard designed to explore a pizza business’s revenue, order activity, and product performance.
I used SQL to calculate key metrics and analyze sales patterns, then built a Power BI dashboard to present the results clearly.
The dashboard tracks total revenue, total orders, and average order value. It also highlights top-selling pizzas, sales distribution by category and size, and daily and hourly order trends.
Interactive visualizations help users explore busy periods, compare product performance, and understand which categories contribute most to sales.
Tools: SQL and Power BI.